KAPPA is the leading provider of Dynamic Data Analysis software, training and consulting services. Data are analysed on whatever scale is available, from high frequency, high resolution transient data through low frequency, low resolution rate data in production analysis and on into full field history matching and vertical description using production log and formation test analysis. Generation 5 speeds workflows, connectivity and provides a powerful platform for the future and automation.
KAPPA-Workstation is an integrated engineering suite which offers analysis and modeling tools for reservoir dynamic data.
Our clients told us to ‘think open and think big…’ For this reason, Generation 5 is fully 64-bit, it uses parallel processing
for today’s multicore processors and data is fully integrated between KAPPA modules and other programs via OpenServer.
-
Saphir - Pressure Transient Analysis

Saphir, the Pressure Transient (PTA) module of KAPPA-Workstation, is the industry standard with over 3000 active installations. With a methodology based on the Bourdet derivative, Saphir offers an extensive and growing analytical model library.
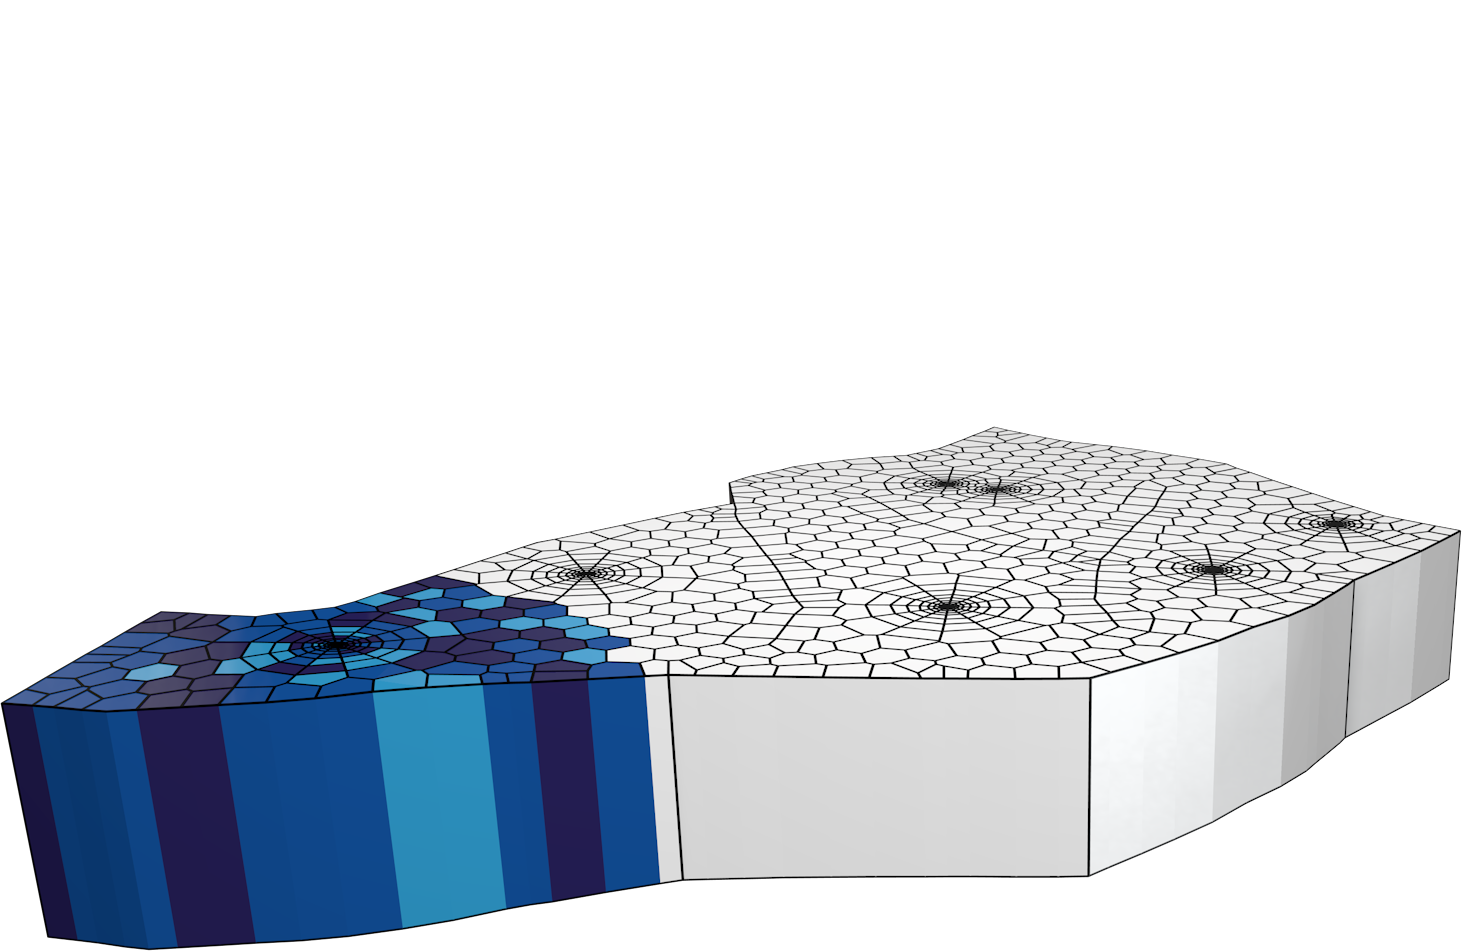
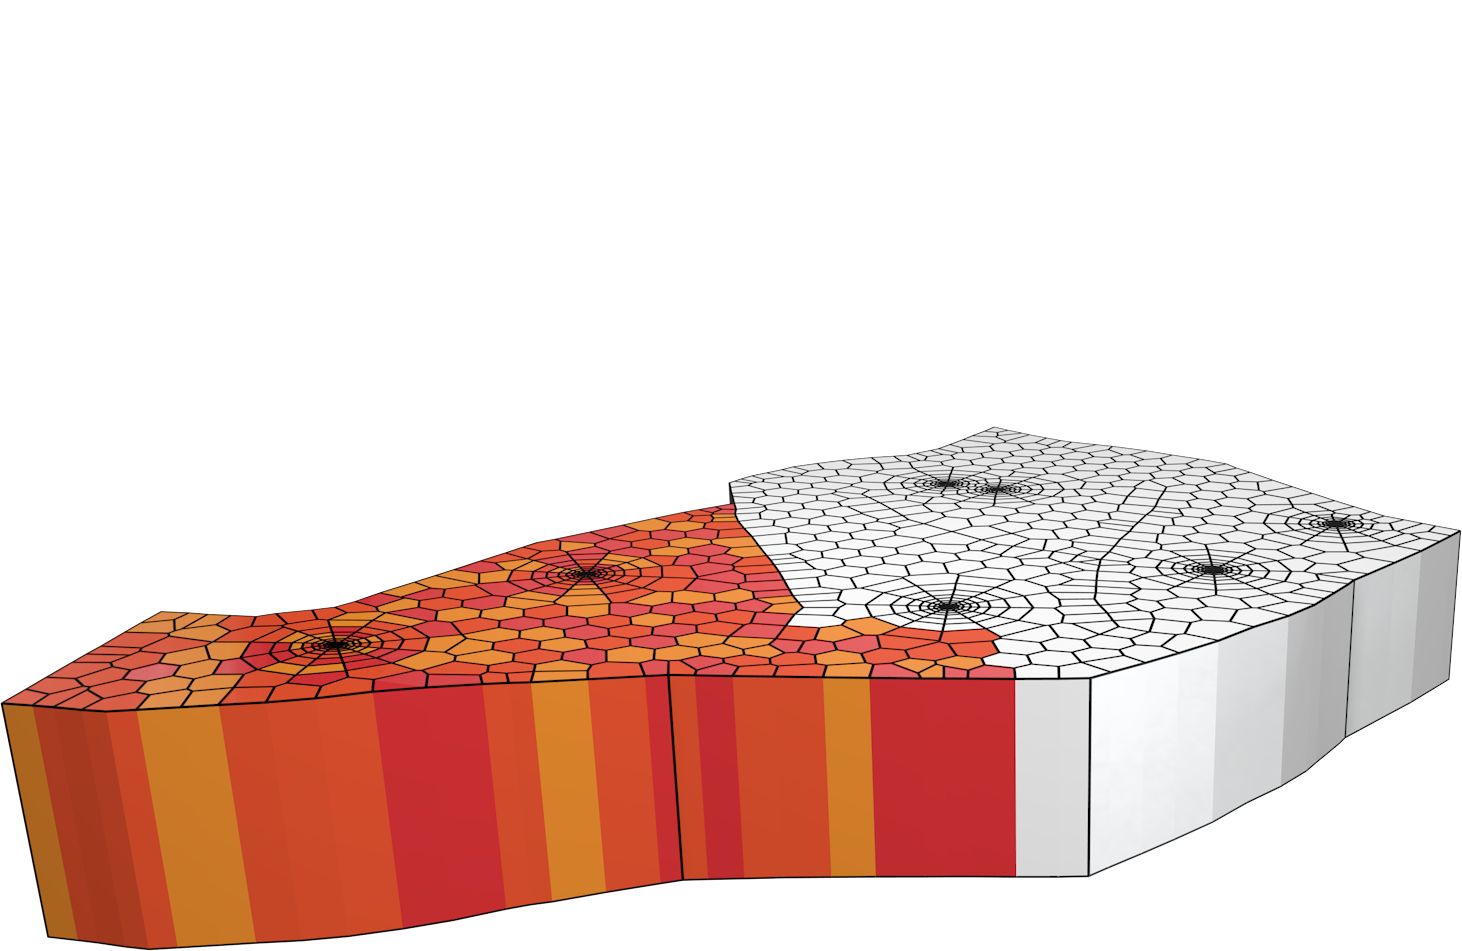
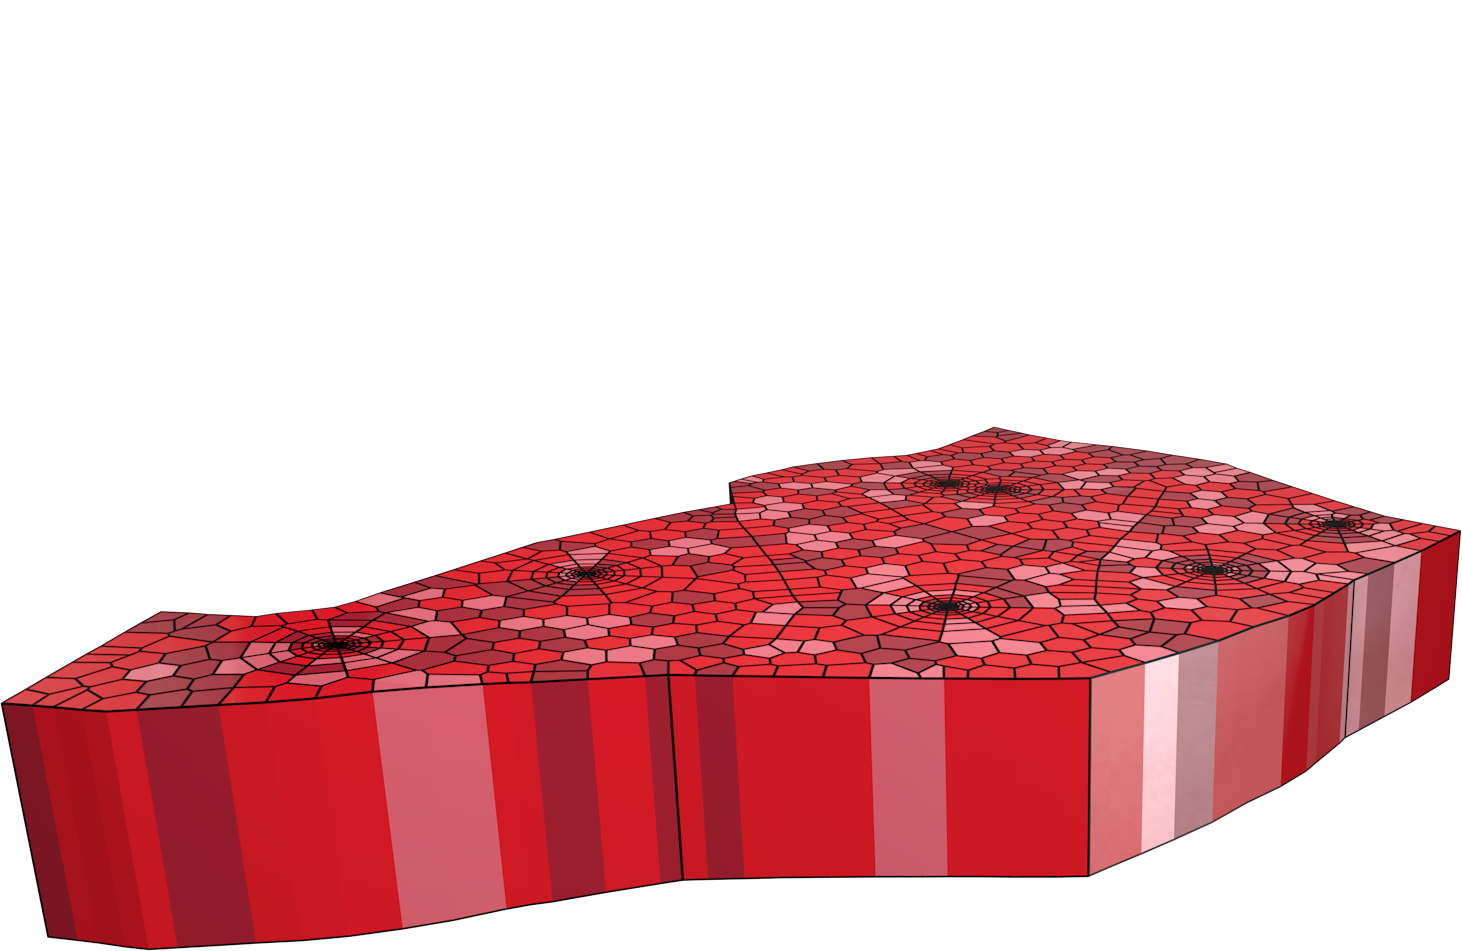
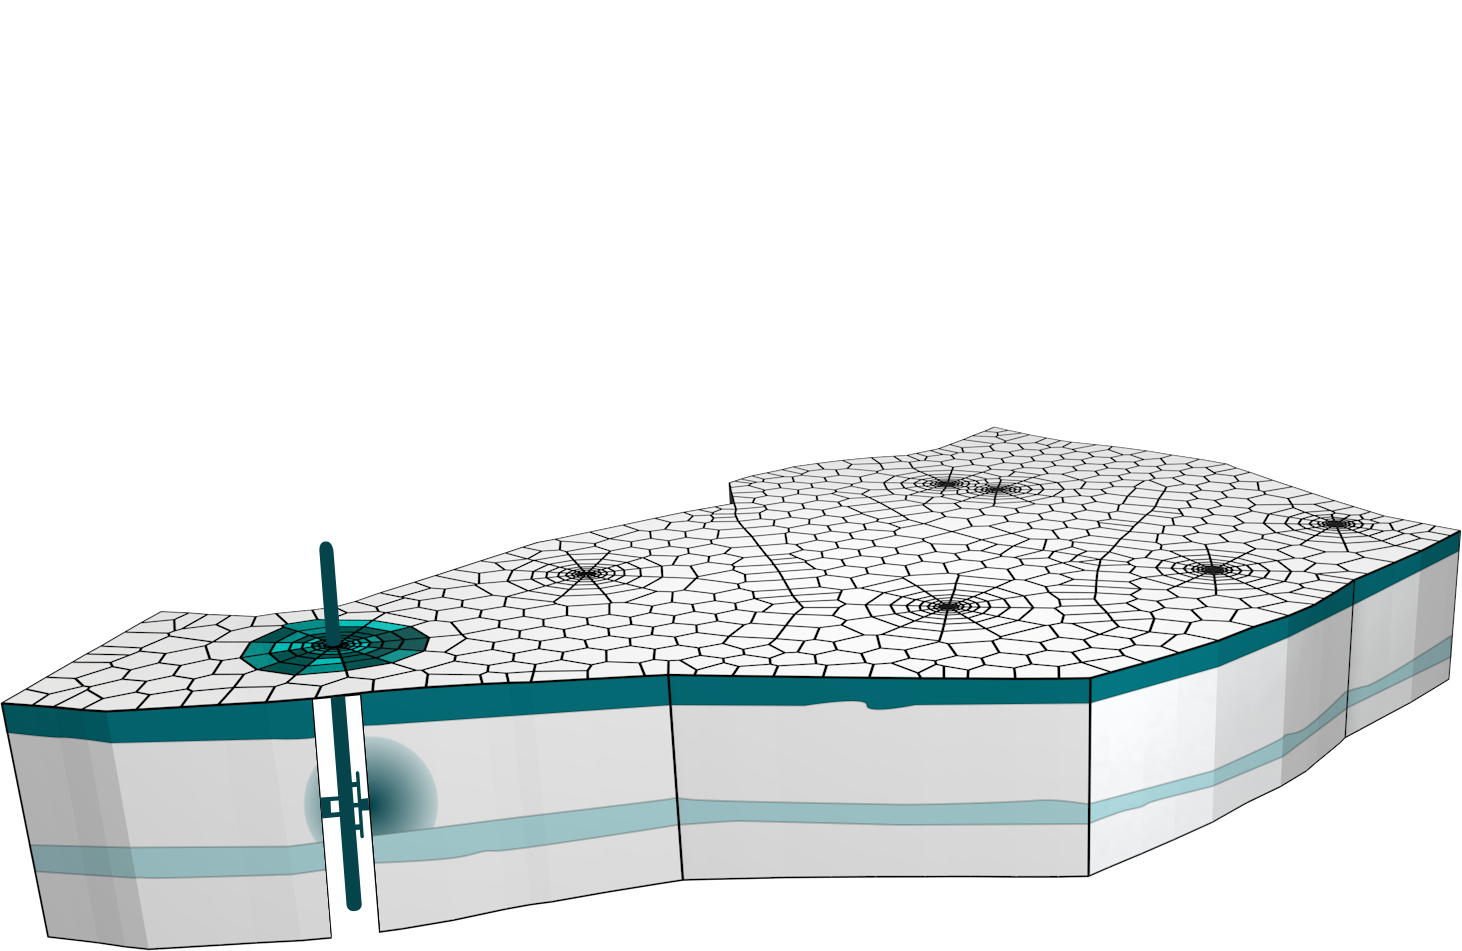
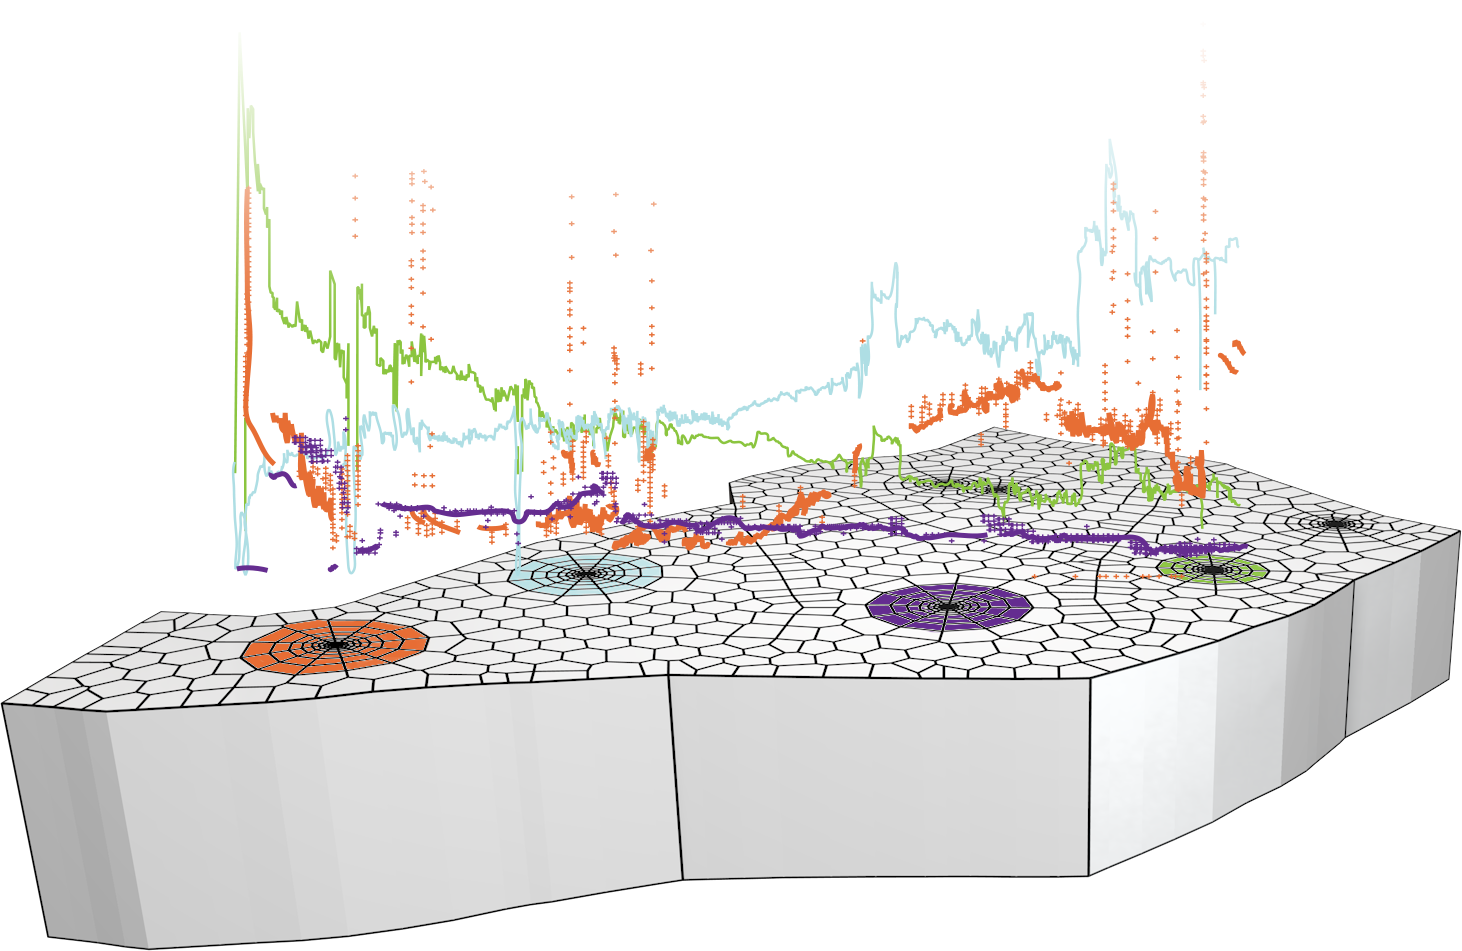
The Voronoi numerical model has been developed to handle the increasing complexity of producing wells, solving exactly the multi-phase and complex geometry cases for multiple wells and layers.
Features
- Industry standard for Pressure Transient Analysis
- Extensive analytical model library
- Interactive diagnostic tools for model matching
- Integrated numerical model with non-linearity
- Test design, QAQC and sensitivity analysis
- Deconvolution and minifrac
 Use in conjunction with Topaze to analyse the rate history to ‘see’ further into the reservoir.
More information
-
Topaze - Rate Transient Analysis

Moving deeper into the reservoir and typically making use of low resolution, low frequency data Rate Transient Analysis (RTA) has recently come of age. Evolving from empirical decline curve methods to modern methodology that shares much with pressure transient analysis (PTA).
With over 1400 commercial licenses, Topaze, the KAPPA-Workstation RTA tool, offers single and multi-well analytical and numerical analysis leading to reserves and production forecasting from the most simple to most complex multiphase case.
Features
- Unconventional Resource modeling
- Multiwell capability
- Seamless connection to KAPPA-Server and other analysis modules
- Extensive analytical model library
- Integrated numerical model with non-linearity
- Complex multiply-fractured horizontal well model
 Use in conjunction with Saphir to also match models with build-up data
More information
-
Rubis - Numerical Modeling

Rubis, the full-field numerical module of the KAPPA-Workstation, offers the specialist and non-specialist alike, an easily built click-and-draw model in minutes as opposed to hours or days. Multiple forecasts, reserves and investigation of possible intervention opportunities can be run and history matched in a very short time frame. Rubis sits between single cell material balance and massive simulation models. It replaces neither, but does much of the work of both.
Features
- Simple, interactive 3D click and draw build process
- Automatic gridding
- Full compatibility with Saphir and Topaze
- Direct Permanent Gauges (KAPPA-Server) data link
- GRDECL and CMG import
- Build and run in minutes
More information
-
Emeraude - Cased Hole Logging

With over 1,100 active licenses, KAPPA Emeraude, the Integrated Cased Hole Logging Platform, is used by all the major service companies, many operating companies and independent contractors worldwide.
Analyze data from any PL string (conventional or multi-probe), multifinger caliper, cement evaluation, noise logs and pulsed neutron tools.
Features
- Industry standard PL platform
- Multi-probe PL tools: FSI, MAPS, FAST, PAI
- Multifinger Caliper interpretation and 3D display
- DTS data display and thermal analysis
- Noise logging processing
- Cement evaluation
- Pulsed Neutron (Sigma) interpretation
More information
-
Azurite - Formation Testing

Combining the capabilities of the new KAPPA Generation 5, Azurite offers, in an integrated environment, the ability to process raw FT data from any service company, switching seamlessly between vs time and vs depth views. QAQC, quick pretest calculation, comprehensive PTA and gradient/contact determination is available in a single workflow.
Features
- Merging of vs depth and vs time data in a single application
- Handling of unlimited number of stations
- Automated test identification / quality rating / pressure and mobility profile vs TVD
- Definition of fluid gradients and contacts
- Pressure Transient Analysis – Analytical model library
- Built-in tool modules and mnemonics catalog
More information
-
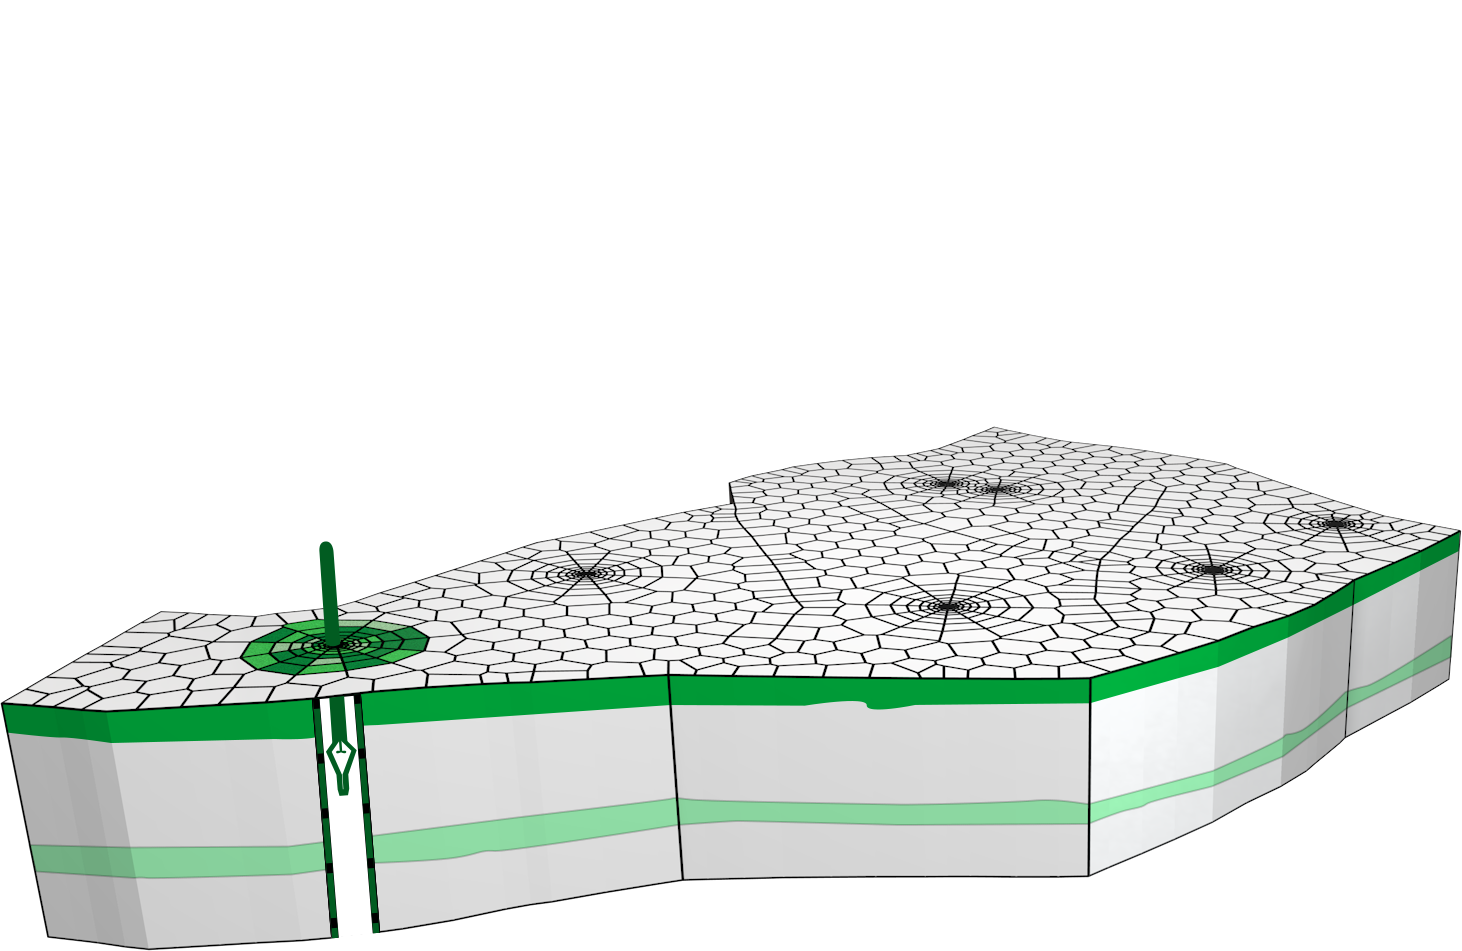
KAPPA-Server

Permanent Gauges are a wonderful, data-rich witness of reservoir behavior, but without organization they only add to the end-user feeling of data overload.
KAPPA-Server addresses the issue of capturing massive Permanent Gauges data in a useable, smart-filtered form for transient/production analysis and history matching.
Features
- Extensive global deployment
- Unlimited gauge and data capability
- Seamless connection to KAPPA-Workstation analysis modules
- Mathpack, alarms and auto-update
- Automatic buildup identification and rate allocation
- Smart filtering and de-noising
- Shared data, object and analysis environment
- Export for P10/P50/P90 forecasts
More information