Pressure Transient Analysis, or PTA, is, in most cases, about analyzing high frequency, high resolution shut-in data. The data are captured during dedicated well test operations such as DSTs or production tests or during routine operational shut-ins by Permanent Downhole Gauges (PDG). The pressure response from these shut-ins can be used to provide information about the reservoir within the radius of investigation for radial flow or the area of investigation for more complex geometries. The diagnostic plot of choice is the loglog plot where the pressure and the Bourdet derivative allow the identification of reservoir geometry and properties, these are then matched with models. Specific operations require specific processing, such as multirate gas tests, interference tests, multilayer tests, etc. The development of deconvolution allows us to combine several of these shut-ins in time to provide information much deeper into the reservoir than would normally be feasible by a shut-in alone.
Saphir is the industry standard PTA software, used by nearly all major IOC’s, NOC’s, Independents and Service Companies. Its simple user interface
and workflow allows for fast training and self-learning for occasional users. For the advanced user, it offers a unique combination of analysis tools, analytical models and
numerical models which can connect to other dynamic data application such as Topaze for Rate Transient Analysis and Rubis for fullfield history
matching.
Saphir Workflow
- Data\nProcessing
- Diagnostic\nTools
- Analytical\nModels
- Numerical\nModels
- Post\nModeling
Data loading in KAPPA-Workstation
Saphir can load an unlimited number of gauges, rates, pressure and other data in almost any format including ASCII, Excel™.
Data transfer from KAPPA-Server
Saphir has real time links with acquisition systems, data drag-and-drop from other KAPPA-Workstation modules and KAPPA-Server, which can identify build-ups.
PVT
Single or multiphase can be handled in Saphir/KAPPA-Workstation. Linear problems can be modeled with constant fluid properties. Non-linear problems can be modeled with correlations as PVT parameters vary with pressure.
Data can be loaded with the following methods:
- Manual input (with correlations)
- PVT report
- Equations of state (EOS)
- PETEX™ file import
QAQC
Gauge data requires QAQC checks before the data can be interpreted. Saphir includes QAQC tools to check and edit the data for the following corrections
- Differences between gauges and gauge drift
- Tidal correction
- Pressure and rate synchronization
- Converting to bottom hole pressure
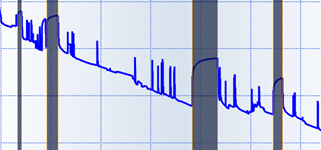
Shut-in Extraction
Automatic shut-in identification in KAPPA-Server can detect shut-ins from raw gauge data. Pressures and rates are then synchronized and the detected shut-ins are automatically sent to Saphir for analysis.
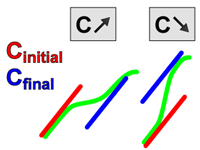
Deconvolution
Deconvolution aims to increase the area of investigation observed in a relatively short build-up period by converting the entire pressure history into an equivalent single rate drawdown.
Saphir can deconvolve on separate buildups with a common Pi (Levitan et Al). Inconsistent buildups can be deconvolved with the KAPPA method, where one reference buildup is deconvolved with only the late time behavior used for other buildups.
Analytical models
Saphir offers a comprehensive built-in analytical catalog combining well, reservoir and boundary models, complemented by external models.
Different wellbore, well, reservoir and boundaries can be combined to simulate a wide range of reservoir models.
Additional capabilities include rate dependent skin, changing wellbore storage, interference from other wells, gas material balance correction, well model changing in time, horizontal and vertical anisotropy.
Wellbore models
Saphir includes constant as well as changing wellbore storage models to fit early time behavior. Changing storage models include, Hegeman, Fair and Spivey.
Well models
To match transient data and effects due to the well completion, the following well models are available in Saphir
- Vertical
- Limited Entry
- Horizontal
- Slanted
- (Multi) Fractured
- Complex
Reservoir models
To match transient data and effects due to the reservoir, the following reservoir models are available in Saphir
- Homogenous
-
Two porosity
- Pseudo steady state
- Slab model
- Sphere model
- Two layer models
-
Composite
- Radial composite
- Linear composite
Boundary models
A range of boundaries can be modeled analytically in Saphir including
- Single faults
- Leaky fault
- Intersecting fault
- Circular fault
- Rectangular faults up to a closed system.
For more advanced boundaries, a numerical model can be used.
External models
For analytical models which are beyond the scope of a standard model with combined standard well, reservoir and boundary conditions, there are a wide range of external analytical models available.
Numerical models
Numerical models are used for geometries beyond the scope of analytical models. This is predominantly 2D but with 3D refinement where needed. These numerical models also address nonlinearity. Pseudopressures are replaced by the exact diffusion equations for real gas, non-Darcy flow, pressure related physical properties, multiphase flow, water and gas injectors, water drives, and desorption models for shale gas.
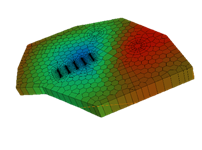
Unstructured grids
A numerical model should be quick and intuitive to build. At the core of the KAPPA-Workstation is the unstructured Voronoi grid.
Interactive build tools and automatic gridding allow the simple construction of even complex well trajectories.
By using flexible upscaling, the same grid can be used at different time scales demanded by transient, production and full field analysis.
Rubis options
With the addition of a Rubis license, all the options available in Rubis are available for transient tests in Saphir. These include:
- Gravity effects (capillary effects & fluid contacts)
- Temperature effects
- Loading from geomodeller
- 3D modeling options available in Rubis
Rubis Sector
A sector of a Rubis full field 3D reservoir model can be imported and run directly in Saphir for a given time range. The starting point is the dynamic state of the simulation at the extraction time. This enables Saphir to simulate 3D / 3-phase flow with gravity and in complete coherence with the reservoir model.
Improve tool
This option is used to improve the fit between the actual data and the current theoretical model by varying the selected parameters of the model.
It is possible to regress on both the log-log and the history plots.
Forecasting
A production forecast for any model may be run based on the anticipated producing pressure. Sensitivity to production improvement or decay can be simulated. It is possible to specify a wellhead pressure constraint for the reference well if an intake has been defined.
Sensitivity
Sensitivity analysis may be performed by running the same model with different parameters. The range of parameters can be defined manually, or defined with equal or log spacing between values.
Outputs
Saphir has an extensive range of comparison, reporting, exporting and printing capabilities.
A standard test refers to the simplest form of transient test which assumes the analysis is linear.
Saphir offers a comprehensive built-in analytical catalog combining well, reservoir and boundary models, complemented by external models. A numerical grid can be used for geometries beyond the scope of analytical models.
Permanent Downhole Gauges (PDG) Saphir works seamlessly with KAPPA-Server. In the hands of the user it means the massive data from this important source is smart filtered and build-ups auto-identified and made available immediately for transient analysis, cutting massive data preparation time to minutes.
Multirate gas tests are used for determining rate dependant skin and Absolute Open Flow potential (AOF).
Saphir can evaluate rate depend skin values to include in the analytical or numerical models. AOF and IPR plots are also available to calculate the flow potential of the well.
Multilayer tests
Individual layer properties can be analysed with layer rate data from production logging.
Saphir has the option to analyse commingled layers analytically and interpret layer properties. By analyzing the problem numerically, crossflow can also be considered.
MiniFrac tests
A MiniFrac test consists of an injection period followed by a fall-off. A short fracture is created which is used to design the main fracture stimulation treatment. The short fracture then closes (fracture closure pressure is determined) and reservoir properties are calculated from the reservoir dominated flow.
Saphir includes a specific MiniFrac tool to analyse this data. ‘G-Function’, ‘Square Root’ and ‘After Closure Analysis’ plots are generated.
Interference tests can be used to determine if two or more wells are in pressure communication. When communication exists, reservoir parameters can be obtained similar to that of a typical PTA test.
Saphir includes an ‘Interference test type’, where the pressure response of an observation well is used for the analysis. The analysis can be extended to include numerical and non-linear if required.