Rate Transient Analysis, or RTA, is the natural complement to Pressure Transient Analysis (PTA) when one has pressure and rate data.
RTA can be used to increase the area of investigation when compared to using PTA alone.
Advancements in RTA have progressed partly due to the development of permanent downhole pressure gauges.
Users are able to obtain answers that were previously only available from PTA.
The advantage is that information is available at no extra cost as there is no deferred production.
RTA started in the 1920s on a purely empirical basis, and as a financial tool however it has now evolved to a modern methodology
that shares a lot of analysis and modeling tools with PTA. The long-term production can be modeled and forecasting is based on real models as opposed to an empirical function.
Topaze is fully compatible with Saphir data and models. An extensive analytical model catalog and numerical capability provides reliable history matching and forecasting.
Topaze Workflow
- Data\nProcessing
- Diagnostic\nTools
- Modeling
- Post\nModeling
- DCA
Data loading in KAPPA-Workstation
Topaze can load an unlimited number of gauges, rates, pressure and other data in almost any format including ASCII, Excel™.
Data transfer from KW modules
Data and/or models can be transferred from other KW modules by a simple drag and drop using the KW Browser. Data can also be brought in from KAPPA-Server, which offers several filtering options, and updated by the press of a single button, as new data becomes available in the historians.
PVT
Single or multiphase PVT can be handled in Topaze/KAPPA-Workstation. Linear problems can be modeled with constant or transformed fluid properties. When changes to PVT properties cannot be ignored, non-linear models can be constructed.
Varying PVT properties can be defined using:
- Black oil correlations
- PVT reports
- Equations of state (EOS)
- PETEX file imports
Analytical models
Topaze offers a comprehensive built-in analytical catalog combining well, reservoir and boundary models, complemented by external models.
Additional capabilities include rate dependent skin, changing wellbore storage, interference from other wells, gas material balance correction, well model changing in time, horizontal and vertical anisotropy.
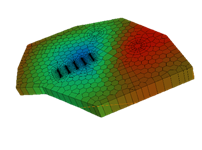
Numerical models
Numerical models are used for geometries beyond the scope of analytical models. This is predominantly 2D but with 3D refinement where needed.
These numerical models also address nonlinearity. Pseudopressures are replaced by the exact diffusion equations for real gas, non-Darcy flow,
pressure related physical properties, multiphase flow, water and gas injectors, water drives, and desorption models for shale gas.
A model for a complex multi fracture horizontal well is available.
Improve tool
This option is used to improve the fit between the actual data and the current theoretical model by varying the selected parameters of the model.
It is possible to regress on both the log-log and the history plots.
Forecasting
After history matching, a production forecast for any model may be run based on the anticipated producing pressure.
Sensitivity to production improvement or decay can be simulated.
It is possible to specify a wellhead pressure constraint for the reference well if an intake has been defined.
Sensitivity
Sensitivity analysis may be performed by running the same model with different parameters.
The range of parameters can be defined manually, or defined with equal or log spacing between values.
Outputs
KAPPA-Workstation has an extensive range of comparison, reporting, exporting and printing capabilities.
Arps plot
Decline curve methods were formalized by Arps in 1945 and have been for many years the conventional technique for analysis and forecasting production data.
Topaze includes this classical technique when pressure data is not available.
Once the decline parameters have been obtained, the recovery at abandonment can be calculated based upon an abandonment rate or time.
Decline curves have limitations based upon the assumptions that the bottom-hole pressure, well behavior and drainage area are all constant.
Modeling the behavior with pressure data and by using a model based approach, avoids these limitations.
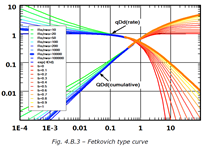
Fetkovich type curve
The Fetkovich plot displays the rate and cumulative volume data against the elapsed time on a log-log scale.
The original Fetkovich type curves were developed for constant (or only slightly changing) downhole pressures
and were used to estimate the drainage area and the decline parameter.
The Fetkovich curve in Topaze however, serves as a comparison between the model and the data only.