Basic HTML Version


Ecrin v4.12 - Doc v4.12.02 - © KAPPA 1988-2009
Topaze Guided Session #1
•
TopGS01 - 22/25
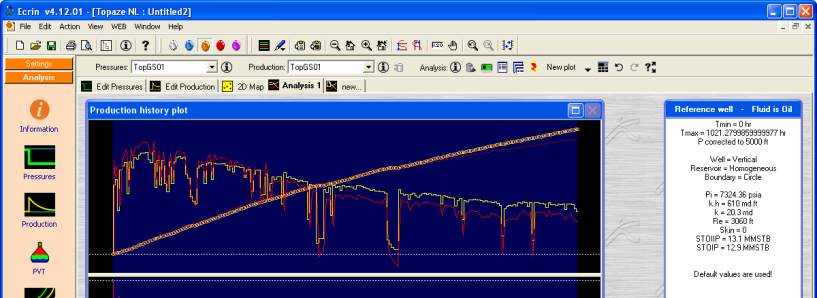
Fig. C01.13 • Rates /cumulative and pressure generated; Single step loglog display
On the history plot, pressure simulated from the input rates is displayed. Also on the loglog
and all Blasingame plots, the model response is now smooth. This is because what is displayed
is only the response to a single pressure (this is similar to using a drawdown type-curve and it
is used to avoid the erratic behavior caused essentially by the superposition and the time
function used te= Q/q).
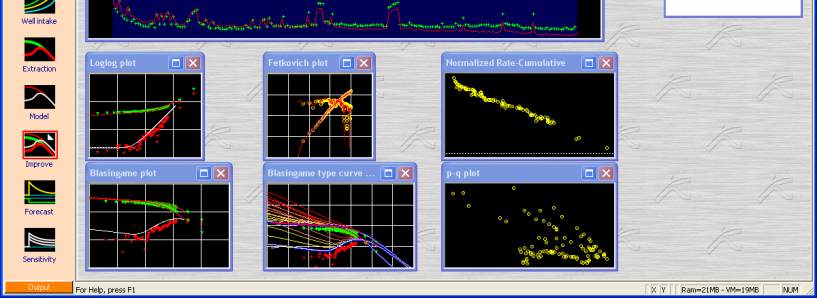
Each of the 3 plots (Fetkovich, loglog, and Blasingame) includes drag options. When the model
is dragged on one of them, the change is reflected on the others. You can experiment with the
drag on the main screen. Note that the drag does not affect the simulation itself, i.e. the model
on the History plot. To validate a drag, the model should be re-generated with the new
parameters. A shortcut for doing this is the toolbar icon .
Right click on the loglog and select 'Reset match' when you are done so that we are back to
the original match point.
If you do not reset the match, a drag should always be followed by a new generation of the
model to update the History plot.