Page 133 - Emeraude 2.60 Tutorial
Basic HTML Version
Emeraude v2.60 – Doc v2.60.01 - © KAPPA 1988-2010
Guided Interpretation #6
•
B06 - 13/13
Rename it ‘SW82’ and re-order the sequence correctly using the ‘Up’ and ‘Down’ buttons
(top saturation being the earliest).
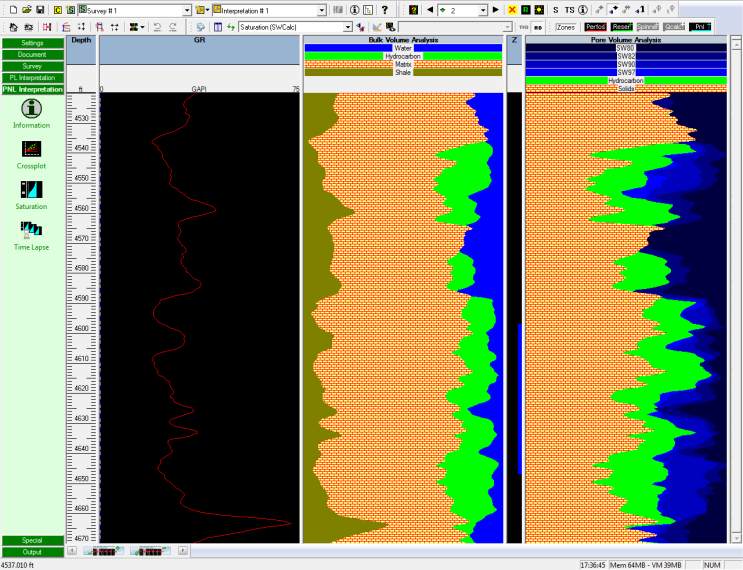
On the PVA view, the display now shows the two additional saturation profiles, and incremental
hydrocarbon depletion volumes are now represented by increasingly lighter shades of blue.
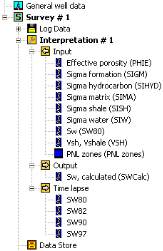
Fig. B06.21 • Data browser
Fig. B06.22 • Time lapse interpretation
This concludes Guided Interpretation#6.

