Basic HTML Version


VA – GP - OA: Numerical Multiphase PTA
p 14/29
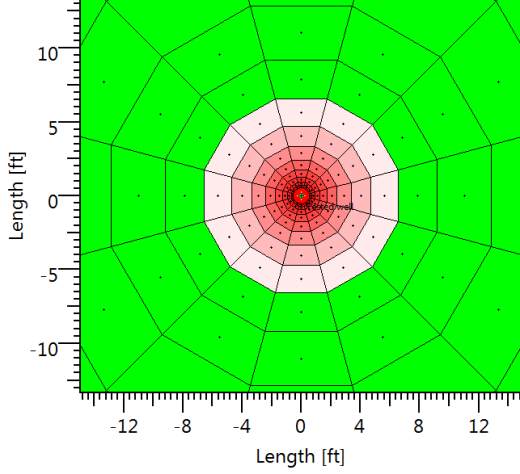
Figure 17: Gas saturation map at the end of the production period (R=50,000 ft, k=200 mD)
When the depletion is larger, as shown on Figure 18, the bubble point is reached immediately.
In this case, a wider gas zone appears from the first time step and continues its expansion
during the production phase. As a consequence, oscillations can be seen from the beginning on
the loglog derivative. Again, reducing the gridding progression ratio clearly reduces the
oscillations level.
Figure 18: Effect of the discretization during production period (R=50,000 ft, k=100 mD)
0.01
0.1
1
10
100
1000
10000
Time [hr]
100
1000
K=100mD
K=100mD refined