Basic HTML Version


OH – ET – VA - LL: Analysis of Dynamic Data in Shale Gas Reservoirs – Part 1 – Version 2 (December 2010)
p 16/24
Naturally, if we use an analytical model for fractured horizontal well, we will also reproduce
this behaviour. For this reason, the error using such model will be limited to the nonlinearity
(similar to what we faced in §9).
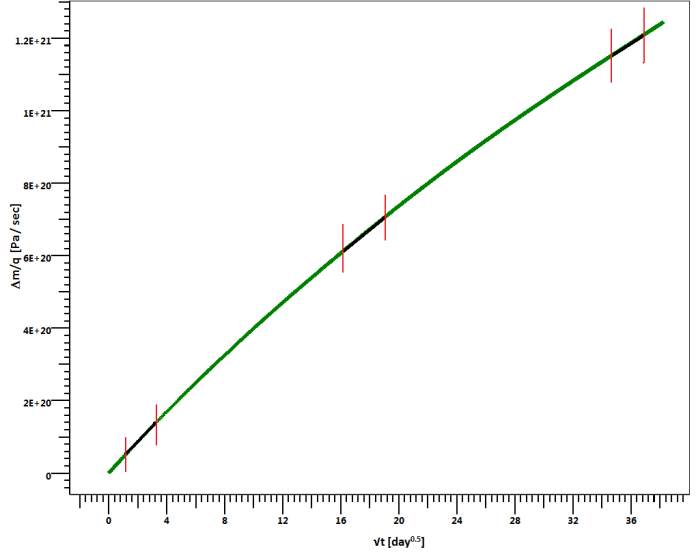
If we stick to the single fracture analytical model and try to draw a linear flow straight line, we
will get an additional error, depending on where we focus to make the match. The error will go
up to 120% if we focus on the intermediate times.
Drawing a straight line of a square root plot
For our reference case, the errors will therefore be the following:
Permeability
Numerical model
Fractured horizontal well
analytical model
Single fracture analytical
model / Straight line
k.X
f
2
(md.ft
2
)
k.X
f
2
(md.ft
2
)
Error
k.X
f
2
(md.ft
2
)
Error
1E-4 md
400
512
28%
540-880
35 - 120%
The divergence of the derivative between the two models is actually a “temporary” one. If we
keep the same permeability (1E-4 md) but simulate for a very long time (... 500 years!), we
will get the following response: After deviating from the single fracture case, the derivative of
our simulation bends back up to return and merge towards the single fracture derivative. At a
point both derivatives merge. Note however that this behaviour is particular to the current
geometry (and to the comparison with a single fracture of equivalent length), we may not see
it with longer fractures, or when more of them are simulated.