Basic HTML Version


OH – ST - ET: Analysis of Dynamic Data in Shale Gas Reservoirs – Part 2
p 13/18
5 - Nonlinear numerical model with desorption
Finally, let us integrate desorption to account for another process possibly at play in this shale
gas case. From our laboratory studies, we can expect that the desorption effect may play a
very limited role in the gas production of this shale gas well, as we can see that the Langmuir
pressure (pressure needed to desorb half of the Langmuir volume) is quite low compared to
our FBHP, and the Langmuir volume in this shale play is low as well.
Let us check this with the model. After calibration of the model including the desorption effect,
we have:
History match, loglog match, and model parameters
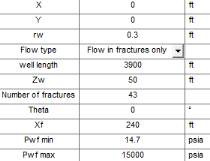
For desorption, we have used the parameters given in the first page of this document :Vl= 70
scf/ton, rock density = 2.6 g/cc, saturated condition with Swi = 0.25. As it is shown here, its
effect hardly plays a role during the production time, as we only need to change by 5 feet the
fracture half length to obtain a good match. This is as we expected.
5000
15000
25000
35000
Gas rate [Mscf/D]
5E+8
1.5E+9
2.5E+9
Gas volume [scf]
qg
Qg
qg model
Qg model
0
500
1000
1500
2000
2500
3000
3500
4000
4500
5000
5500
Time [hr]
4000
9000
Pressure [psia]
Pi
p
Forec ast
Production history plot (Gas rate [Mscf/D], Pressure [psia] vs Time [hr])
1
10
100
1000
Time [hr]
0.1
1
Pressure [psi]
Integral of normalized pressure
Integral of normalized pressure Deriv at iv e
Loglog plot: Int[(pi-p)/q]/te and d[Int[(pi-p)/q]/te]/dln(te) [psi] vs te [hr]