Basic HTML Version


OH – ST - ET: Analysis of Dynamic Data in Shale Gas Reservoirs – Part 2
p 16/18
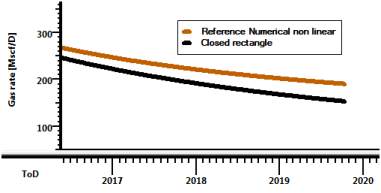
To estimate the drained volume for 10 years of production, let us use a “closed box” approach:
we surround the well area with a closed rectangle until the tail production rate q deviates from
the original one by 20% after 10 years production. We then consider this volume to be the
drainage volume for this production period.
Comparison of q rate deviation
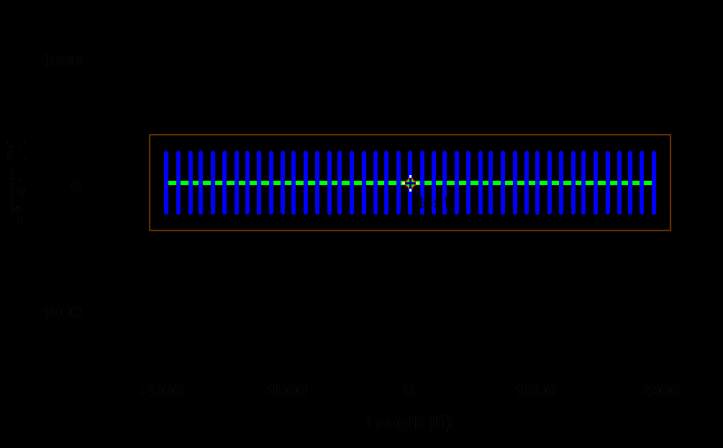
Enclosed rectangle for drainage determination
Following the analysis, we obtained as drainage area dimensions: 4170*770 ft
2
. From this we
can deduce a closed box STGIIP of 6.7 bscf, where 4.2 bscf will be produced considering a
producing period of 10-year using the last flowing well pressure as control.
Because desorption has little effect in this case, by applying the same technique we found a
similar drainage area: 4170*770 ft
2
. However STGIIP in this case would be 8.2 bscf, because
of the adsorbed gas, despite a similar production of 4.3 bscf during our 10-year forecast.
Consequently, one must take careful considerations when evaluating STGIIP because although
the volume in place may be significantly higher when considering the adsorbed gas potential, it
does not necessarily mean that production will increase significantly along with it.