Basic HTML Version


OH – ST - ET: Analysis of Dynamic Data in Shale Gas Reservoirs – Part 2
p 1/18
The Analysis of Dynamic Data
in Shale Gas Reservoirs – Part 2
Olivier Houzé – Simon Trin - Eric Tauzin
0B
In Part 1 we presented the different hypotheses and analysis techniques currently available for
the study of multiple fractures horizontal wells in the environment of shale gas. We simulated
a synthetic case using our best numerical model so far, and evaluated the approximations /
errors created when using more simplistic methods. We finished by listing other mechanisms
that may affect the production of a shale gas reservoir and are not yet integrated in the most
advanced KAPPA model.
We have updated Part 1 (originally from July 2010) in order to take
into account the release of this Part 2.
In this document we use the methods presented in Part 1 to analyze real life data. We start
with a classical straight line analysis, we refine using an analytical model to finish with our
numerical model. In this process we show that simpler methods, though not recommended to
perform the final diagnostic and forecast, are an integral part of the workflow.
1 - Case study
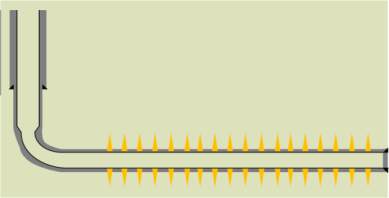
In our case study we have access to eight months of production and pressure data of a
multiple fractures horizontal well in a deep shale gas reservoir. The tables, schematic and
history plot below show the available production, pressure, reservoir and well information:
Reservoir data
Initial Reservoir pressure, psia
11005
Reservoir temperature, °F
305
Net pay, ft
100
Porosity, %
7.6
Matrix permeability estimates, mD
5e-5 to 1.5e-4 (9.35e-5)
Water saturation, Swr, %
25
Desorption parameters
Rock density, g/cc
2.6
Langmuir Volume Vl, scf/ton
70
Langmuir Pressure Pl, psia
750
Well data
Horizontal drain length, ft
3900
Initial estimated number of fractures
40
Fracture half length, ft
220 -360
Completion type
cased hole
Last FBHP, psia
1770
Well completion schematic