Plots#
You can create your own plot from new or existing data.
import kappa_sdk as ka
from datetime import datetime

# Specify the connection configuration
ka_server_address = 'https://your-ka-instance.com'

plot_name = "Expenses by month"
connection = ka.Connection(ka_server_address, verify_ssl=False)
all_fields = connection.get_fields()

my_field = next(x for x in all_fields if x.name == "My Field")
my_well = next(x for x in my_field.wells if x.name == "My Well")
plot = my_well.create_plot(plot_name, stacked_bars=True)
months = [datetime(2024, 1, 1), datetime(2024, 2, 1), datetime(2024, 3, 1), datetime(2024, 4, 1)]
gas_channel = plot.add_embedded_data(ka.Vector(months, [30, 30, 30, 30]), channel_name="Gasoline", show_lines=False)
gas_channel.set_channel_aspect(ka.DrawingStyle.as_bar)
gas_channel.set_band_aspect(opacity=100, color="Blue")

food_channel = plot.add_embedded_data(ka.Vector(months, [170, 170, 370, 170]), channel_name="Food", show_lines=False)
food_channel.set_channel_aspect(ka.DrawingStyle.as_bar)
food_channel.set_band_aspect(opacity=100, color="Red")

rent_channel = plot.add_embedded_data(ka.Vector(months, [500, 500, 500, 500]), channel_name="Rent", show_lines=False)
rent_channel.set_channel_aspect(ka.DrawingStyle.as_bar)
rent_channel.set_band_aspect(opacity=100, color="#A2C9F1")

utilities_channel = plot.add_embedded_data(ka.Vector(months, [200, 200, 200, 200]), channel_name="Utilities", show_lines=False)
utilities_channel.set_channel_aspect(ka.DrawingStyle.as_bar)
utilities_channel.set_band_aspect(opacity=100, color="Green")
plot.update_plot()
The above script example will generate the following plot:
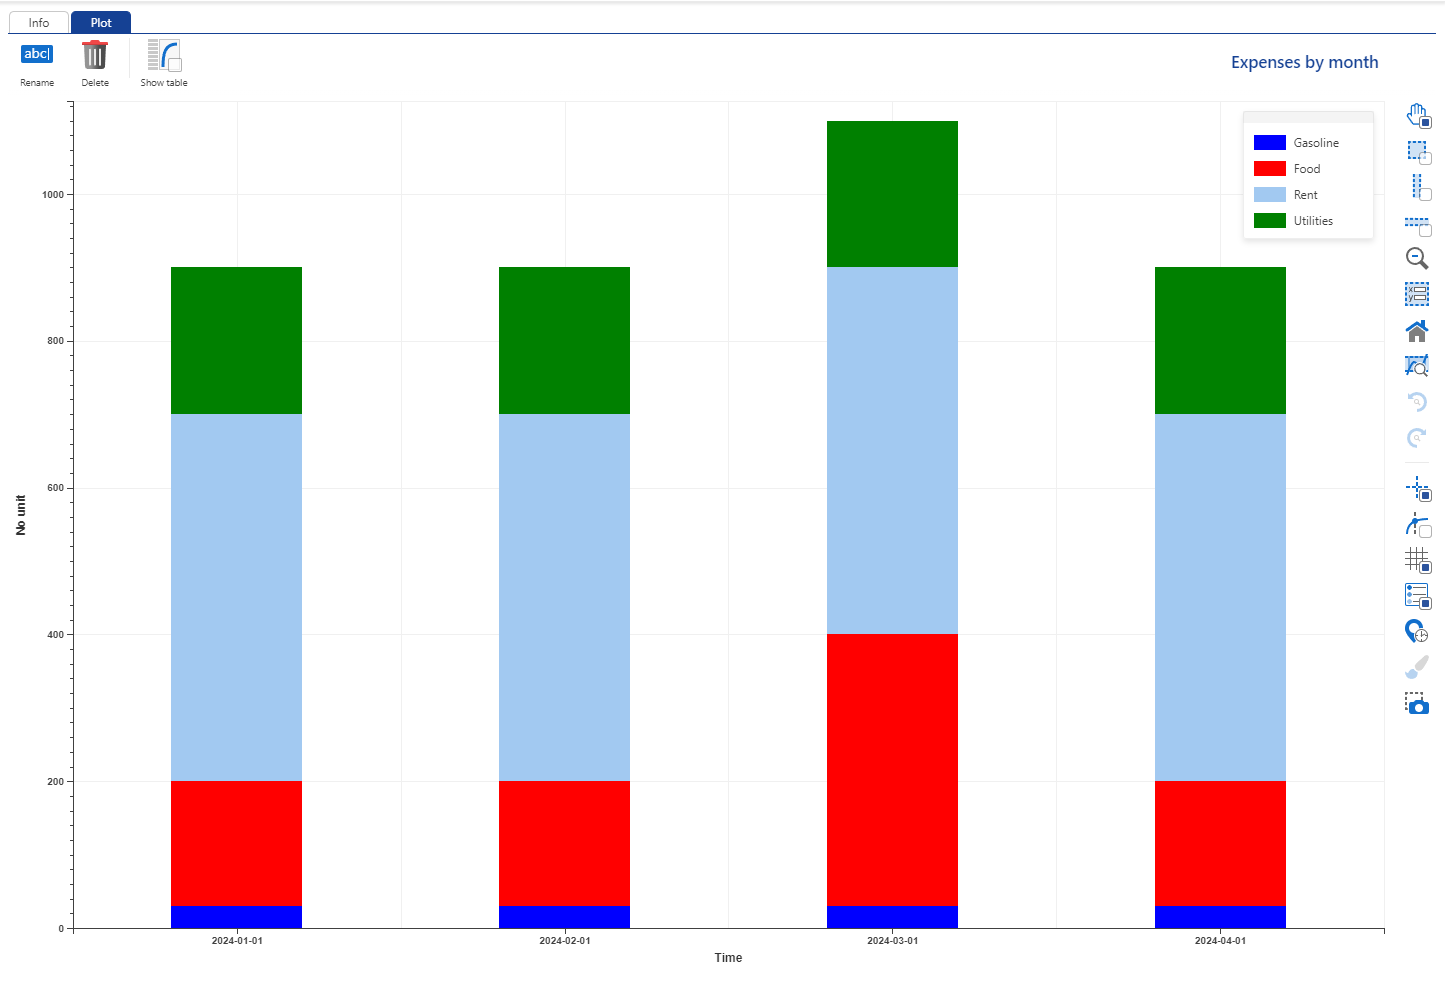
The previous example demonstrates working with new data through the kappa_sdk.Plot.add_embedded_data() method. However, if you need to incorporate existing data into your plot, you can leverage the kappa_sdk.Plot.add_existing_data() method instead.
As this example shows, you can customise each channel as you like by changing the lines, symbols or bands appearance.
Another example:
from datetime import datetime, timedelta
import kappa_sdk as ka
import random
import numpy as np
from typing import List, Tuple


def compute_average_by_day(vector: ka.Vector) -> Tuple[List[datetime], List[float]]:
    days = np.array([date.strftime('%Y-%m-%d') for date in vector.dates])
    values = np.array(vector.values)

    unique_days_str = np.unique(days)
    unique_days = [datetime.strptime(day, '%Y-%m-%d') for day in unique_days_str]

    averages = [values[days == day].mean() for day in unique_days_str]
    return unique_days, averages


# Specify the connection configuration
ka_server_address = 'https://kubernetes-preprod.kappa.int/'

field_name = 'AB'
well_name = 'Well #1'
plot_name = "Plot "
vector_size = 10000
connection = ka.Connection(ka_server_address, verify_ssl=False)

field = next(x for x in connection.get_fields() if x.name == field_name)
well = next(x for x in field.wells if x.name == well_name)
plot = next((x for x in well.plots if x.name == plot_name), None)
if plot is not None:
    plot.delete()
plot = well.create_plot(plot_name)
days = [datetime(2024, 1, 1) + timedelta(minutes=5 * i) for i in range(vector_size)]
values = [random.uniform(0, 1) for _ in range(vector_size)]
vector = ka.Vector(days, values)
unique_days, average = compute_average_by_day(vector)

# CHANNEL EXAMPLE WITH EXISTING DATA FROM KA
# oil_rate = next(x for x in well.data if x.data_type == 'qo')
# oil_channel = plot.add_existing_data(oil_rate, channel_name="Oil Rate", show_lines=True)

# CHANNEL EXAMPLE WITH INLINE DATA
oil_channel = plot.add_embedded_data(ka.Vector(days, values), channel_name="Oil Rate", show_lines=True, y_measure=ka.MeasureEnum.liquid_rate)
oil_channel.set_symbols_aspect(color="Blue", symbol_type=ka.SymbolAspectEnum.circle)

oil_average_channel = plot.add_embedded_data(ka.Vector(unique_days, average), channel_name="Oil rates", show_symbols=False, hide_in_legend=False, y_measure=ka.MeasureEnum.liquid_rate)
oil_average_channel.set_lines_aspect(color="Orange")

missing_data_channel = plot.add_embedded_data(ka.Vector([days[100], days[200], days[500], days[800]], [0, 1, 0, 1]), channel_name="Missing Data")
missing_data_channel.set_band_aspect(color="Red", opacity=100)
missing_data_channel.set_channel_aspect(drawing_style=ka.DrawingStyle.as_vertical_line)

invalid_data_channel = plot.add_embedded_data(ka.Vector([days[1000], days[2000], days[3500], days[3800], days[4000], days[4200]], [0, 1, 0, 1, 0, 1]), channel_name="Invalid Data")
invalid_data_channel.set_band_aspect(color="Green", opacity=100)
invalid_data_channel.set_channel_aspect(drawing_style=ka.DrawingStyle.as_vertical_line)

allocation_error_channel = plot.add_embedded_data(ka.Vector([days[300], days[400], days[6000], days[8000], days[9000], days[9400]], [0, 1, 0, 1, 0, 1]), channel_name="Allocation error")
allocation_error_channel.set_band_aspect(color="Purple", opacity=100)
allocation_error_channel.set_channel_aspect(drawing_style=ka.DrawingStyle.as_vertical_line)

plot.update_plot()
This example will generate the following plot:
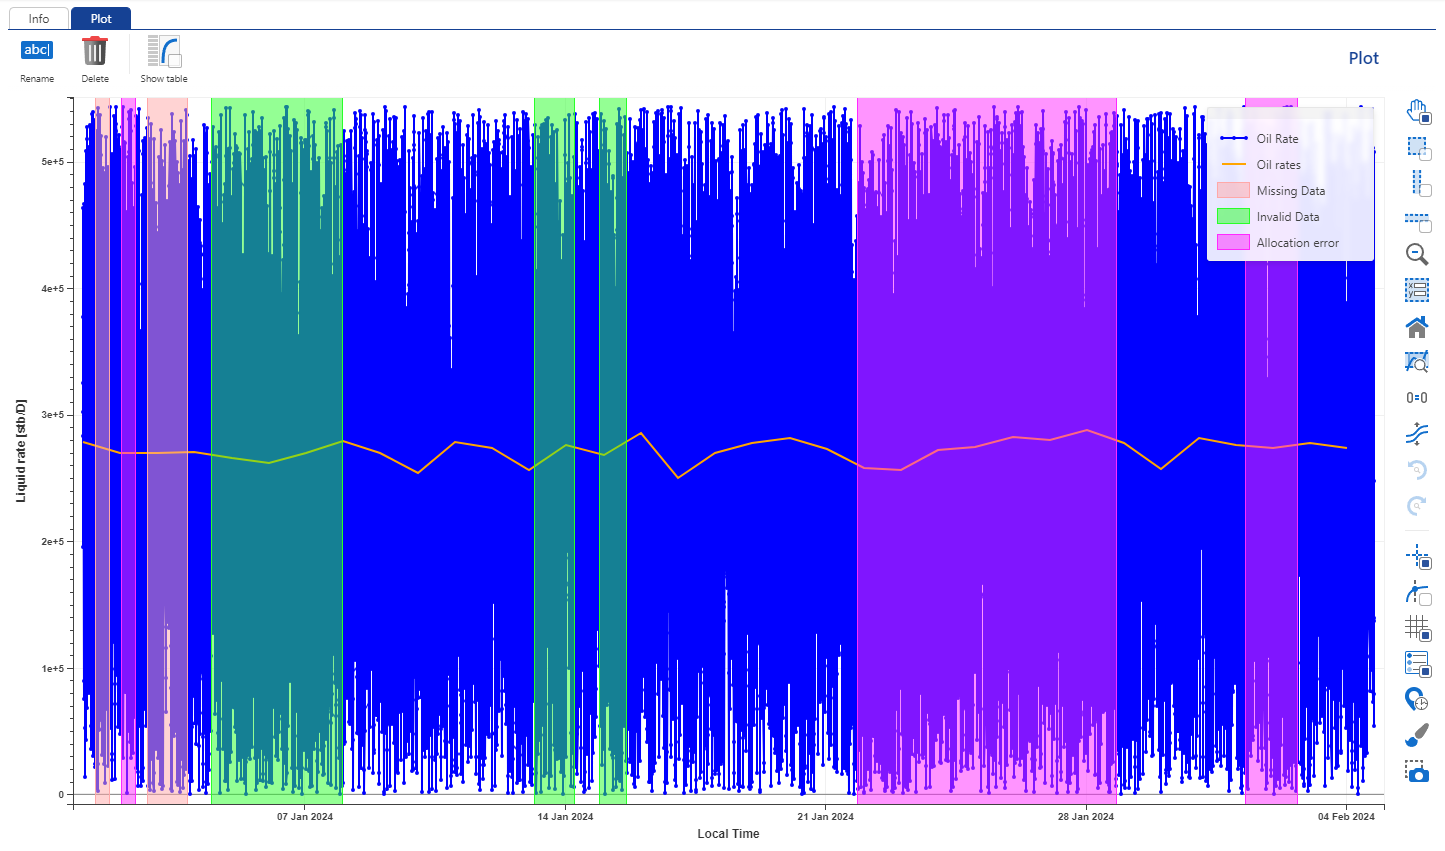
Note
The last added channel will be the one visible in the foreground.