Page 107 - Emeraude 2.60 Tutorial
Basic HTML Version

Emeraude v2.60 – Doc v2.60.01 - © KAPPA 1988-2010
Guided Interpretation #5 • B05 - 19/32
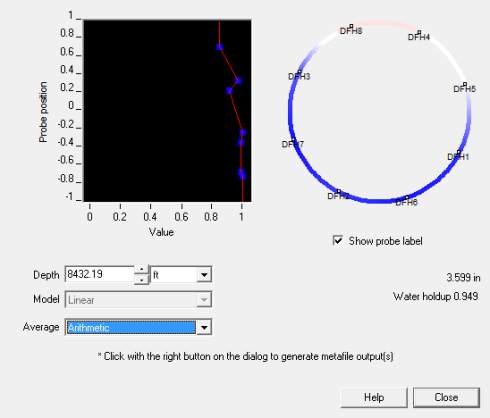
Fig. B05.22
• Arithmetic average holdup
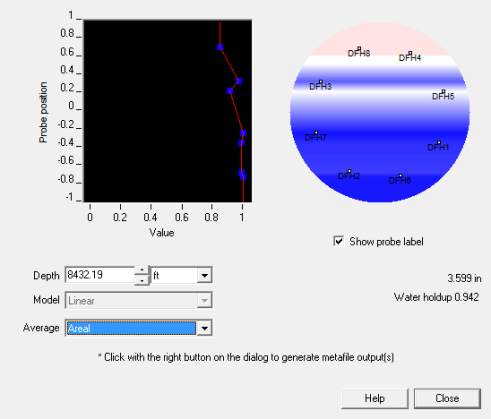
Fig. B05.23 • Areal average holdup
The plot on the left indicates the position of the probes (relative to the center of the tool) and
their values (symbols), and the associated model used to represent the probe measurements
across the section (here Linear represented by the red line). You can experiment with the
‘MapFlo’ model, dedicated to Schlumberger holdup tools, which ensures vertical stratification.
B05.6 • Interpretation
The interpretation will be based on the following:
Vapp as calculated from the spinner.
VW stations.
Water holdup, calculated using the two DEFT measurements.
dPdZ, pressure derivative.
When the reference channels are built, Emeraude will add reference and match views
automatically. In order to make some room for those views, you can hide all tracks except the
depth, Gamma ray and Z tracks. For the purpose of spinner calibration, bring the SPIN and
SCVL tracks on the screen, as well as the caliper C1C2 track.
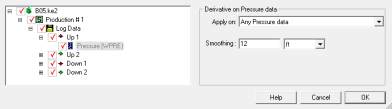
The dPdZ channels need to be built. This can be done in one go for all passes:
Inside the browser, click on the pressure channel for one pass,
Select the ‘Derivative’ option (right click or
button).
Enter a smoothing of say 12ft and click on the ‘Log Data’ node to in the tree view: this
selects all child nodes onto which the same processing will be applied.
Fig. B05.24 • Pressure derivative for all passes

