Page 11 - Emeraude 2.60 Tutorial
Basic HTML Version
Emeraude v2.60 – Doc v2.60.01 - © KAPPA 1988-2010
Guided Interpretation #1
•
B01 - 9/38
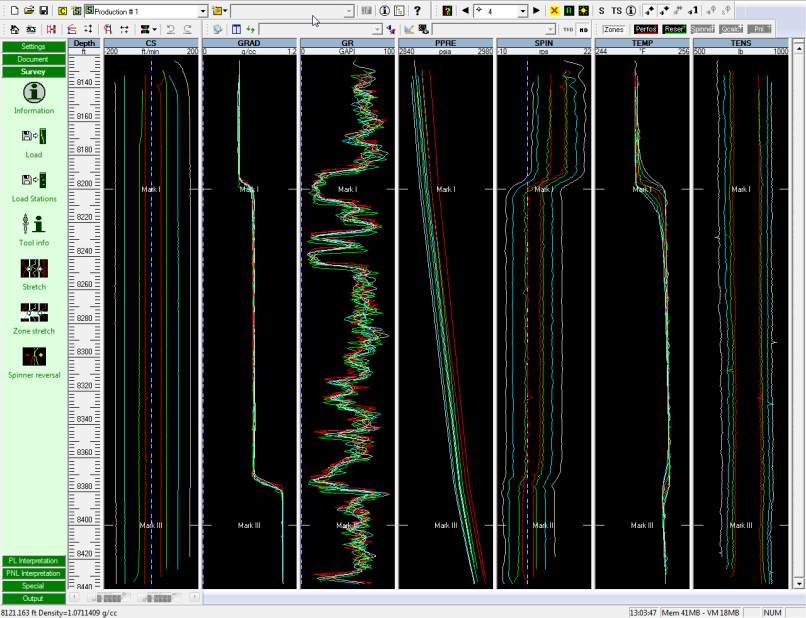
Fig. B01.10 • Main screen after loading
B01.6
• Creating and manipulating plots
The eight passes have been loaded in the ‘Production #1’ survey. Emeraude automatically
creates a plot for each channel type and each mnemonic found in the up and down passes.
These plots are also scaled automatically to the entire logged interval and show all the
acquired curves. In this example, there are 7 automatic plots: Cable Speed (CS), Density
(GRAD), Gamma Ray (GR), Pressure (PPRE), Flow Meter (SPIN), Temperature (TEMP), Tension
(TENS).
All channels in a particular pass are plotted with a unique aspect corresponding to the index of
the pass in the type (red=1, green=2, etc) defined by the Document Display Settings. The
application default Display Settings, used to initialize the Document Display Settings, can be
changed in the Default Display option of the Settings panel.

