Page 114 - Emeraude 2.60 Tutorial
Basic HTML Version
Emeraude v2.60 – Doc v2.60.01 - © KAPPA 1988-2010
Guided Interpretation #5 • B05 - 26/32
Detailed information about the MPT processing is available in Guided session #8 for the
Schlumberger FSI, and in Guided session #9 for the Sondex MAPS.
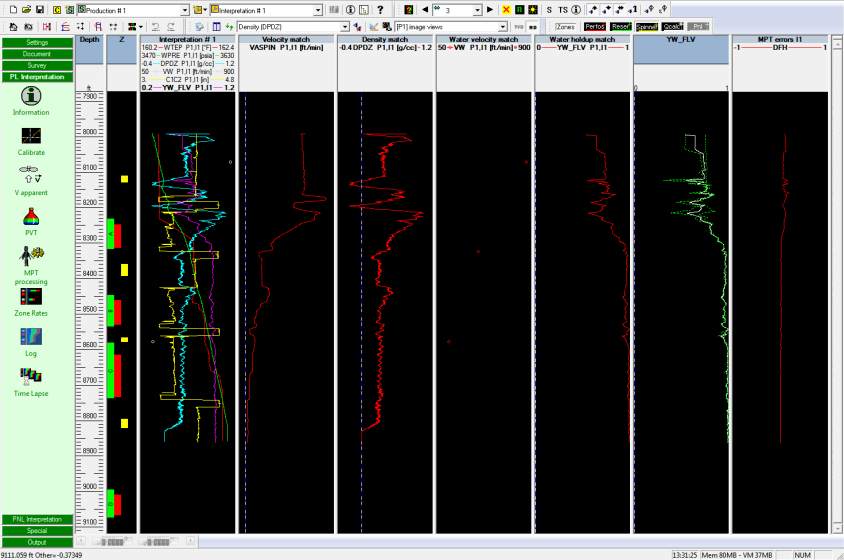
At the end of the process, an automatic view called ‘YW_FLV’ is added. It contains the average
water holdup from the processing of the Dual DEFT: the YW_FLV curve from the Interpretation
input as requested (in white) and the 2 YW_FLV generated (reconstructed) by the independent
MPT processing for passes Up 2 and Down 2. There is also a track called ‘MPT errors I1’ which
shows the arithmetic average of passes Up 2 and Down 2 relative errors (e.g. average of the
DFHx_KERR data). Above 8300 ft, the error curve deviates slightly from 0, indicating that the
reconstructed data differ from the raw data. As reference channels are built, the corresponding
match views are created.
You can setup the screen as in Fig. B05.31.
Fig. B05.31 • Reference channels and match views.

