Page 118 - Emeraude 2.60 Tutorial
Basic HTML Version
Emeraude v2.60 – Doc v2.60.01 - © KAPPA 1988-2010
Guided Interpretation #5 • B05 - 30/32
Unlike the schematic log, the complete log is not making use of VW. The complete log is based
only on VAPP, YW, and DPDZ. The consequence is that for the top section of the log, the
slippage velocity cannot be considered a variable during the regression. The value found on
the top calculation zone is used.
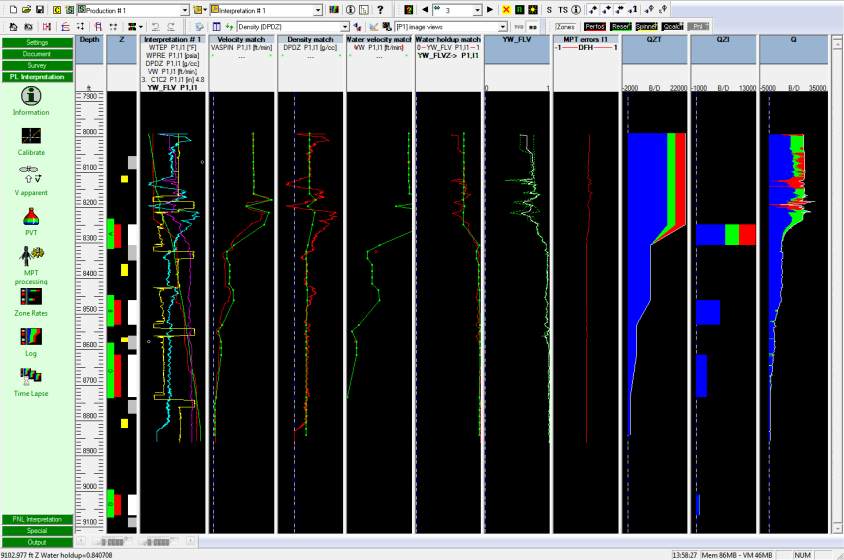
On the above figure, one can see two well-defined intervals at the top where the solution
produces a very small velocity and mostly gas. This corresponds to regions where the density
is exhibiting two sharp peaks. Recall that this density was generated from the pressure
derivative in a highly deviated well.... Furthermore, the significant diameter changes in this
region may impact the pressure differential dramatically. Besides, the DEFT measurements do
also exhibit erratic response in the same region. Overall, the density is the most affected and it
is causing the erroneous complete log. One possible way of correcting the log would be to
interactively edit the reference density. Another might be to give it less weight to density in
the solution, at least for the interval corresponding to the top 2 calculation zones. But since
we are in 3-phase the density will still affect the solution.
In ‘Zone Rates’, ‘Rate calculation’ tab:
Set the weight for the density to 0.1 on zones 1 & 2.
Leave the Zone Rates solution unchanged.
Exit with OK. Re-generate the complete log, Fig. B05.36.
The Complete logs look a bit better but certainly not in full agreement with our schematics.
The Complete logs are nevertheless not a representation of our diagnostic; we will keep them
only to illustrate the Well view facility in the next section.
Fig. B05.36 • Complete logs re-generated

