Page 126 - Emeraude 2.60 Tutorial
Basic HTML Version


Emeraude v2.60 – Doc v2.60.01 - © KAPPA 1988-2010
Guided Interpretation #6
•
B06 - 6/13
B06.3 • Cross-plots
B06.3.1 • Basic cross-plot functions
Zoom the depth
from 4,000 to 4,900 ft. Hit ‘Total range’ to apply the changes.
Press OK.
Define two PNL zones from 4,360 to 4,417 ft and from
4,597 to 4,647 ft.
You can use the
button in the zone toolbar, or else the
button to type in the
exact depths.
Click the ‘Crossplot’ button. The cross-plot options depend on the interpretation
model
chosen
as follows:
Single Water model:
,
eq
-
eq
,
ma
– V
ma
Dual Water model:
wa
– S
wb
With the Single Water model, cross-plots can be built with or without the shale correction.
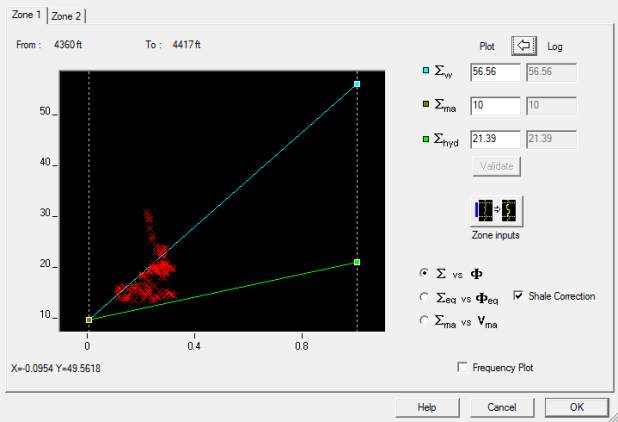
Fig. B06.11 • Cross-plots
At the top right of the plot are displayed the log values and the cross-plot values. When
entering the dialog those values are the same. In our example the
cross-plot seems to
warrant a higher
w
, perhaps a higher
ma
. The local value of those parameters can be modified
either by direct edition in the field, and
, by dragging the lines on the screen or
moving the line end-points.
Manual edition
You can experiment by changing manually the value of
ma
to 13 and click
. The
plot is updated.
You can change the
values on the plot by clicking and dragging the end-points: the new
values are updated in the boxes.

