Page 128 - Emeraude 2.60 Tutorial
Basic HTML Version


Emeraude v2.60 – Doc v2.60.01 - © KAPPA 1988-2010
Guided Interpretation #6
•
B06 - 8/13
B06.3.2 • Additional cross-plots
In order to help refine the input parameters, two other cross-plots (in addition to
can be
built when an initial value of the water saturation is available, as often happens with the Open
Hole logs. These additional cross-plots are:
eq
-
eq
and
ma
– V
ma.
Return to ‘Survey’, open the file B06_tl.las. Accept to define mnemos that are unknown.
Define SW80 as a Water saturation
Use the filter to skip the other columns.
Select ‘Import’. The new curve is loaded in Pass Down 2
Go to the ‘Information’ option of the PNL panel.
Click on the
option for the input SW.
Select the channel from pass Down2.
Return to the ‘Crossplot’ option.
Select the Crossplot option
eq
-
eq
:
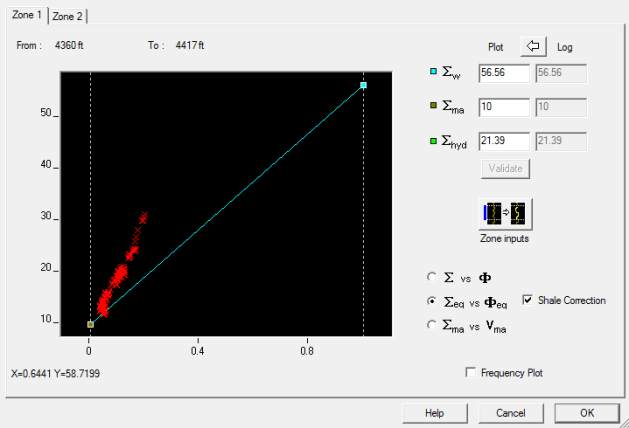
Fig. B06.14 • Cross plots
This plot removes the influence of hydrocarbon on the data. Hence on the cross-plot the data
points should lie on a line joining
ma, and
water – provided of course Sw has not changed
since the first measurement (open hole logs in our case), which is not true in this example. In
fact it is rarely true in most wells in which pulsed neutron logs are run but we are here only
trying to validate our choice of parameters.
Drag the line to fit the data points (of course
ma will change). Set
w to 88,
.

