Page 15 - Emeraude 2.60 Tutorial
Basic HTML Version

Emeraude v2.60 – Doc v2.60.01 - © KAPPA 1988-2010
Guided Interpretation #1
•
B01 - 13/38
B01.7
• Using the Data Browser
In addition to the Scale and Display toolbars, the main screen contains the Main toolbar. From
left to right options are: New, Open, Save, Edit comment, Create a new survey, Survey list,
Create a new interpretation, Interpretation list, Calculation of schematic rate logs, General job
information, the Data browser, and Help.
The survey and interpretation lists are used to view/change the active survey/interpretation.
At this stage, the Interpretation list is empty and the survey list contains only ‘Production #1’.
Click on the browser icon to open the browser dialog.
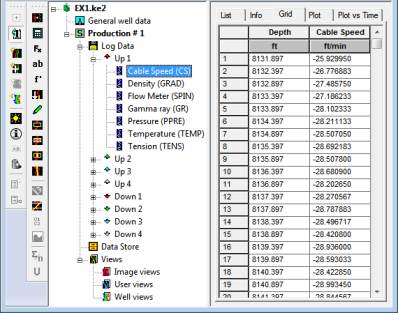
The window is divided into two areas. On the left is a hierarchical tree view of the data in the
file (Fig. B01.14). A node in the tree stating with a ‘+’ can be unfolded with a click on the ‘+’
(or double-click on the icon).
Open the ‘Production #1’ node.
A node labelled ‘Log data’ contains all passes. This node in turn unfolds to show the individual
pass nodes, which contain the individual channels, or curves. Inside the survey icon also
appears a ‘Data Store’ icon. The data store is used to store copies of existing channels for data
manipulation, averaging, etc. The right side of the browser contains 5 tabs:
List
,
Info
,
Grid
,
Plot
,
Plot vs Time
, used when the selected node in the tree is a channel.
Fig. B01.14 • Browser tree

