Page 174 - Emeraude 2.60 Tutorial
Basic HTML Version
Emeraude v2.60 – Doc v2.60 - © KAPPA 1988-2010
Guided Interpretation #9 • B09 - 4/22
Fig. B09.3 • Image views dialog
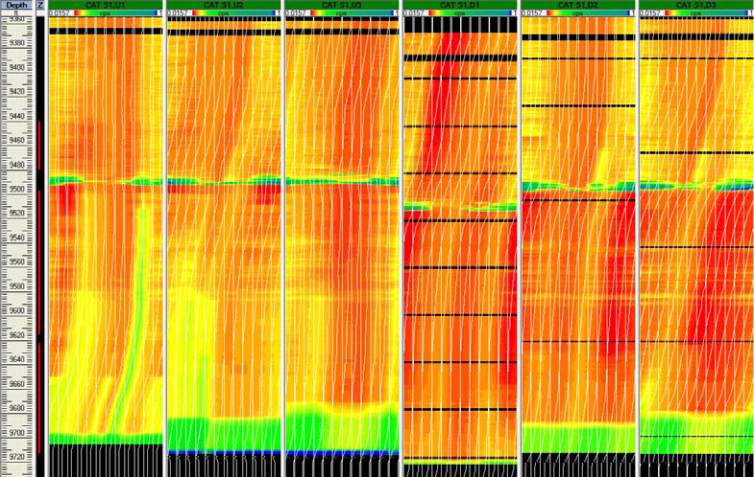
The screen has been cleaned (only the depth and Z tracks have been kept) and a new
snapshot ‘CAT images’ is created with the image for each pass (the view title contains survey
and pass short name, thanks to the ‘add suffix’ option selected when invoking the template).
In the color scale chosen, red is gas, green is oil and blue is water: the scale limits have been
automatically set to the same range from one view to the other (form min = min of views min
to max = max of views max), in order to allow easy comparison of the images.
Fig. B09.4 • CAT image views display
Passes down 2 and down 3 look fairly consistent and will later be used in the processing. Note
that none of the probes have failed. If probes had failed, it could be interesting to combine
different passes in the same image view. Let us create a combined pass view (D2 and D3) for
the sake of demonstration.

