Page 187 - Emeraude 2.60 Tutorial
Basic HTML Version

Emeraude v2.60 – Doc v2.60 - © KAPPA 1988-2010
Guided Interpretation #9 • B09 - 17/22
It is beyond the scope of this guided session to resolve the difference in this particular case, the
main goal here being to illustrate the workflow.
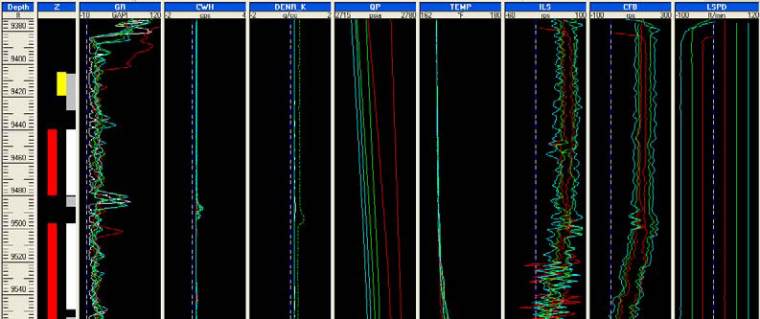
Fig. B09.17 • basic sensors snapshot
We can build image views for reconstructed channels and compare those with the raw ones.
¾
Empty the screen (keep only the depth track).
¾
Recall the Holdup image view for combined passes D2 and D3 (CAT D2 – D3).
¾
Right click on it and in Properties, remove ‘show measure point’ (if not yet done).
¾
Create a new Image view in the browser. As a Combined passes MPT processing was run in
the current interpretation, the property dialog offers by default ‘Combined passes’ and
‘Reconstructed’ for the processed tools and it can be checked that passes D2 and D3 have
been correctly selected for combination. Select the CAT-N tool. Remove ‘show measure
point’. Uncheck the Autoscale option, and keep Min=0 and Max=1 (you may want to Apply
to all image views to ensure that this scale setting will be applied to all image views
displaying the same tool). Call the image view ‘CAT D2 – D3 Reconstructed’.
The reconstructed view exhibits the 2D model prediction in agreement with the segregation
constraint. This can be seen on the cross section: display both the raw and reconstructed data
cross sections at 9438.1ft. Select ‘Areal’ for the raw data display: although not perfect (as seen on
the ‘Constraints’ view, the stratification constraint mostly holds on.

