Page 186 - Emeraude 2.60 Tutorial
Basic HTML Version
Emeraude v2.60 – Doc v2.60 - © KAPPA 1988-2010
Guided Interpretation #9 • B09 - 16/22
The other views are displaying MPT averages (dashed lines from calculated log data node) and
Interpretation inputs (continuous line). Curves are identical because of the combined process.
We take a further look at the results. The newly generated channels (reconstructed, errors) can
also be seen on the automatic views.
¾
Be sure that you saved the Processing snapshot.
¾
Recall the snapshot ‘Vapps’; In the display toolbar, you can display raw vs reconstructed
channels, or the errors, using the display options
.
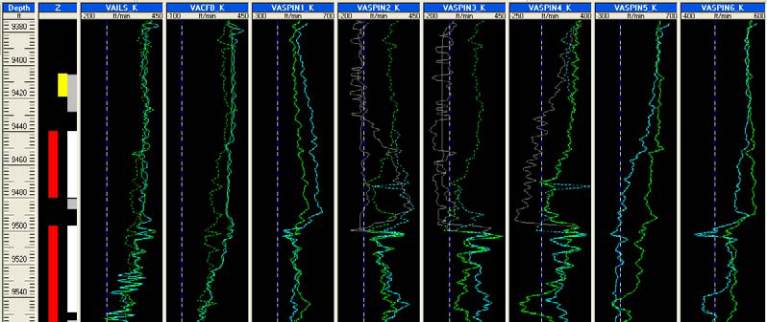
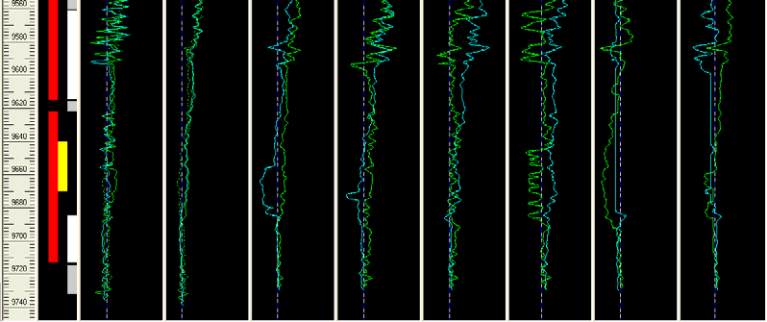
Below is the view of the apparent velocities. The reconstructed channels appear in dashed lines.
The central spinners are not matched exactly (two first tracks), but the agreement is rather good.
Fig. B09.16 • Apparent velocities: raw vs reconstructed
Agreement is not as good with the density tool (recall the ‘Basic sensors’ snapshot).
There are several reasons why we do not see consistent results between the conventional
measurements and the value derived from the MPT processing, among which:
‐
Some tools are focused (e.g. DENR) while we compare it to an average on the cross-
section.
‐
The velocity profile may be different from the imposed stratified model (30° deviated well).
‐
…

