Page 197 - Emeraude 2.60 Tutorial
Basic HTML Version
Emeraude v2.60 – Doc v2.60.01 - © KAPPA 1988-2010
Guided Interpretation #10 B10 - 5/12
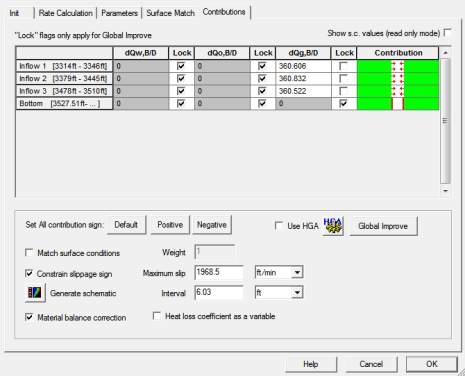
Fig. B10.8 • Contributions
In the present solution, the surface rates were split (to the Bg local variation) between the 3
inflows equally.
¾
Press
to see this first solution, in terms of logs (Temperature and rate).
The simulated temperature (blue with dots) is not matching the measurement. But this is just our
starting point.

