Page 3 - Emeraude 2.60 Tutorial
Basic HTML Version


Emeraude v2.60 – Doc v2.60.01 - © KAPPA 1988-2010
Guided Interpretation #1
•
B01 - 1/38
B01 – Guided Interpretation #1
This session is an introduction to the basic features of Emeraude v2.60 through a two-phase
Oil-Gas example. The session is limited to loading and processing a single production period
with emphasis on software mechanics rather than interpretation methodology. The original log
data has been submitted to various manipulations including some mnemonic redefinition.
In the examples, this symbol represents an interactive step or action.
Even though this is not always an explicit step of the Guided Session, we recommend that you
call the Help button in the various dialogs. All the software reference is on-line, and is
accessed contextually.
B01.1 • Creating an Emeraude document
Start Emeraude.
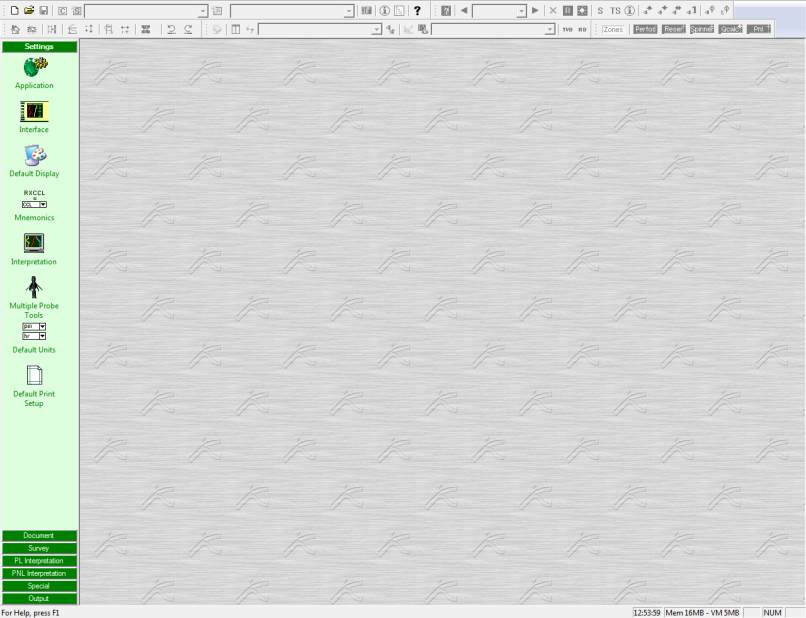
The main program window is displayed with a control panel to the left, several toolbars at the
top, and an empty area that will subsequently be used for plotting the logs. Every toolbar has
a ‘grip control’ (shown with 2 vertical lines) that can be used to drag the toolbar and dock it at
a different position, or leave it as a ‘floating’ toolbar inside the plotting area. The original
layout of the toolbars will depend on your screen resolution.
Fig. B01.1 • Settings screen

