Page 66 - Emeraude 2.60 Tutorial
Basic HTML Version
Emeraude v2.60 – Doc v2.60.01 - © KAPPA 1988-2010
Guided Interpretation #3
•
B03 - 4/11
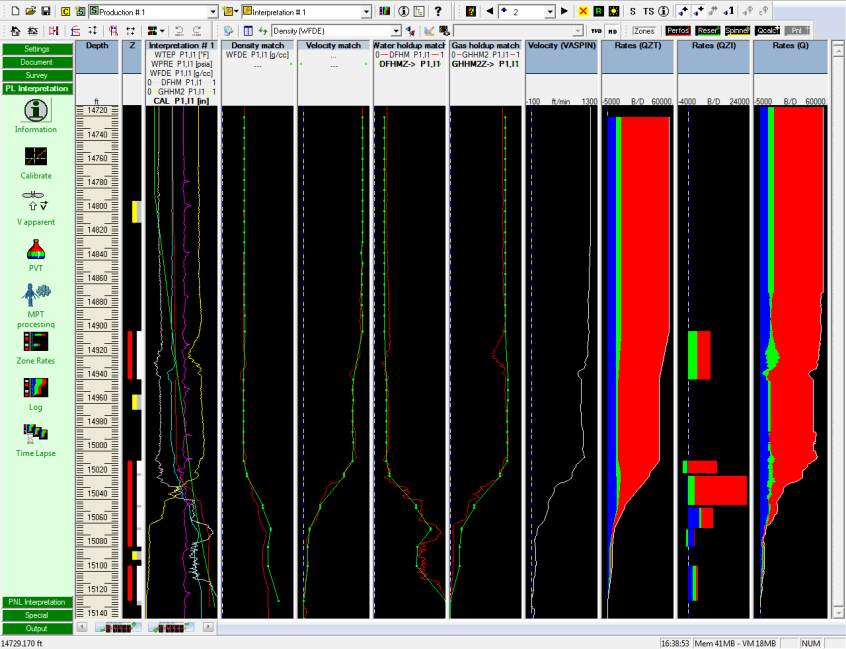
Fig. B03.5 • Rate logs generated
The QZI logs show that the second contributing interval is producing gas and taking water and
oil at the same time. This is certainly not physical and other contributing zones show a similar
behavior. The reason for this is that all zones have been solved independently and
contributions obtained by successive differences after the fact. It should be clear that this
procedure does not guarantee the identity of signs for the contributions of any zone.
The Global Regression can be used to resolve inconsistencies of this type when they arise, by
imposing additional constraints to the solution. This is illustrated in the following section.
It should be pointed out that there is some redundancy in the input measurements and some
inconsistency as well. This is revealed by the fact that the regression does not succeed to
match at the same time, the holdups, and the density. The relative weights assigned in the
regression on the measurements will of course drive the solution towards one side or the
other.
Hide the Q, the velocity (VASPIN) and the Reference channel tracks. Tile.

