Page 70 - Emeraude 2.60 Tutorial
Basic HTML Version


Emeraude v2.60 – Doc v2.60.01 - © KAPPA 1988-2010
Guided Interpretation #3
•
B03 - 8/11
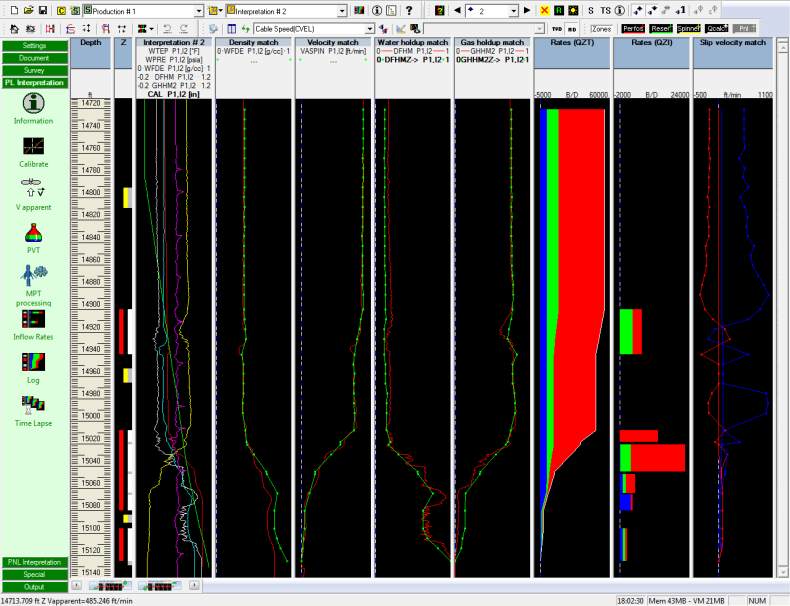
Fig. B03.9 • All phase contributions with the continuous method
It is now interesting to compare the results of both methods. The ‘Continuous’ method gives a
better match for the density, the water holdup and the gas holdup. A new curve is displayed
on the right side titled ‘Slip velocity match’. As the ‘Continuous’ method allows the holdups to
differ from the slip model holdup prediction, this track shows the difference between the slip
model predictions (solid lines) and the slip velocities used by Emeraude for liquid-gas (in red)
and for oil-water (in blue). Only the deviation from the slip models allows matching closely the
holdups and the density.
The weight of the slip model constraint can be modified in the ‘Rate calculation’ tab. The last 2
lines of the table represent the two additional residuals on Yw and Yg. One column represents
the current solution (this is the ‘Calculated’) while the other represents the model prediction
(in the ‘Measured’ column). In situations where there are enough inputs to determine
everything from the data, the ‘Fit’ check boxes on those lines are unticked automatically – see
Guided Sessions #8 and #9.
It is possible to switch between the ‘Zoned’ and ‘Continuous’ methods at any stage of the
diagnosis.

