Page 78 - Emeraude 2.60 Tutorial
Basic HTML Version
Emeraude v2.60 – Doc v2.60.01 - © KAPPA 1988-2010
Guided Interpretation #4
•
B04 - 4/14
Below 686 meters the VAFLOW is negative. From 726 down it is the 9”5/8 casing. It can be
seen on the density and capacitance that most of this section is occupied by water and the
spinner is telling us that this water is going down. We will assume that what is actually
happening is only an apparent down flow and that water falls back only as a result of being
dragged upward by an up flowing light phase, oil.
In this session, we will run two interpretations to substantiate this fact: one using the specific
Apparent Downflow option, the other one using the Temperature.
Click on the ‘Calculation zones’ button and create zones ’Same as Spinner calibration
zones’.
B04.2 • Interpretation with Apparent Downflow
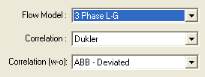
Select ‘Zone Rates’ and choose:
Fig B04.5 • Flow model and Correlation selection
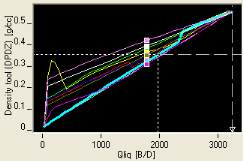
Click on the ‘Rate Calculation’ tab; select the ‘Plot’ display:
Fig B04.6 • Rate Calculation - Plot Display
It can be seen that there is fairly good agreement between the surface rates, the model, and
the measurements.
Move to Zone 3 (Rate Calculation Tab).
The rates are all negative. Checking the pressure/PVT, we know that we are above bubble
point so we toggle the model to Water-Hydrocarbon(L).
Change the Model to ‘Water-Hydrocarbon (L)’.
The ‘Apparent Downflow’ option (ADF) is now enabled.
Check ‘ADF’.

