Page 93 - Emeraude 2.60 Tutorial
Basic HTML Version
Emeraude v2.60 – Doc v2.60.01 - © KAPPA 1988-2010
Guided Interpretation #5 • B05 - 5/32
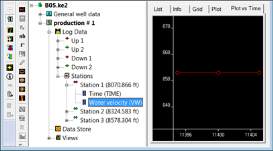
If you open one of the station nodes,
and select the VW channel, the ‘Plot
vs. Time’ tab displays a graph of VW
versus time.
In this particular case the station
contains only 3 identical values. Raw
station data will usually exhibit a
distinct behavior with significant
variations.
Fig. B05.5 • Water velocity
Note that the ‘Stations’ node allows displaying the same measurement for several stations at a
time in the associated ‘Plot vs Time’ tab.
Select the ‘Stations’ node, activates the ‘Plot vs Time’ tab, call the popup menu with a right
mouse click, and under ‘Display multiple data’, select the water velocity. The three
stationary measurements are displayed.
The same feature is offered at the level of each station node, to display different
measurements of the same station in the same plot. Follow the same path as described above,
but select ‘Station 1’ node instead of the ‘Stations’ node.
Stationary data can be edited. For instance, the ’Delete parts’ and the ’Hide parts’ options work
versus time and can be executed directly from the ‘Plot vs time’.
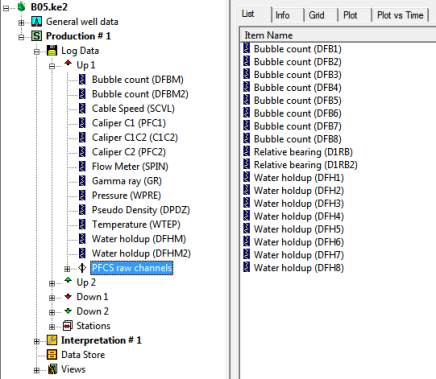
With the browser opened, note that the loaded data is arranged in sub nodes for easy reading
(e.g. PFCS raw channels).
Fig. B05.6 • Data organization

