Basic HTML Version


OH – ET – VA - LL: Analysis of Dynamic Data in Shale Gas Reservoirs – Part 1 – Version 2 (December 2010)
p 8/24
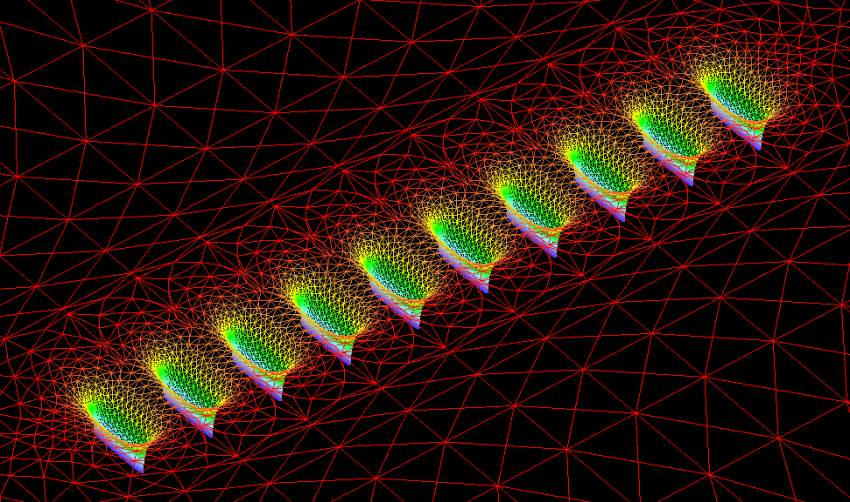
The next figure shows the same simulation, at the same time, in pseudo-2D. The Z axis
represent the pressures while the physical reservoir stays as X and Y.
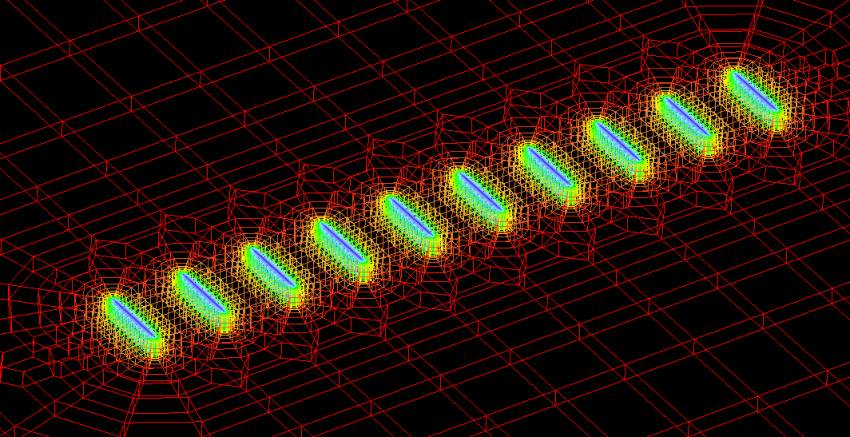
The next figure shows the same case at the same time, but in “true” 3D showing the cell
geometries. Because the gridding itself is 2D it is of limited interest but it will help compare
with the display of the true 3D model.