Basic HTML Version


OH – ET – VA - LL: Analysis of Dynamic Data in Shale Gas Reservoirs – Part 1 – Version 2 (December 2010)
p 21/24
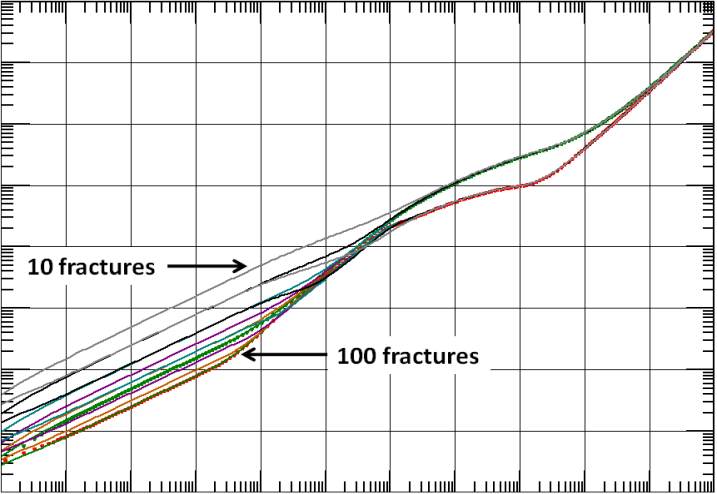
So why did we use 100 fractures in this simulation? Because we need to pile up many fractures
in order to see the SRV fake pseudo-steady-state flow, as shown below where the closed
reservoir case is re-run with less and less fractures:
As already explained in §4, the key parameter controlling the appearance of the SRV close-to
unit slope is actually not the number of fractures but the ratio between the fractures spacing
and their ½ lengths: if the spacing is significantly bigger than X
f
you will never see the
transition zone unit slope. In all other cases the time at which the SRV will show up is a direct
function of the number of fractures (rather, fracture spacing / X
f
): we need about 50 days
when 100 fractures are simulated, 83 days when the number of fractures is lowered to 50,
more than 2 years for 25 fractures.
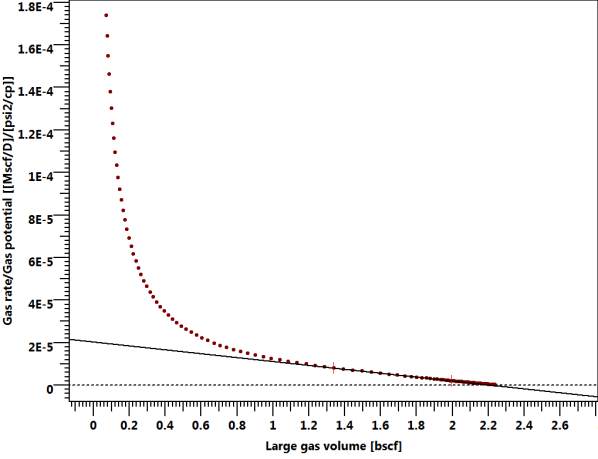
Summary:
In the best cases the material balance plot will provide a reservoir size
corresponding to an inflated version of the volume between the fractures. But you should not
expect this method to be systematically meaningful, and the result it provides can be seen as
secondary.