Basic HTML Version


OH – ST - ET: Analysis of Dynamic Data in Shale Gas Reservoirs – Part 2
p 3/18
2 - Analytical “straight-line” analyses
2.1 - Square root plot
The simplest model assumes a single equivalent fracture with only the “transient” linear flow
observed in the data. A single fracture will produce linearly during its transient flow until it
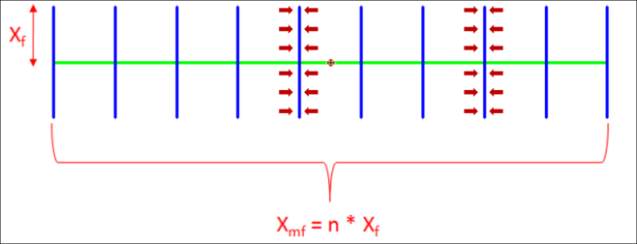
transitions towards infinite acting radial flow. For multiple fractures along the horizontal drain
we consider a single equivalent fracture. Its half-length would be the sum of the individual,
real fractures half lengths.
Equivalent single fracture half length Xmf
The linear flow towards the equivalent fracture is characterized by a linearity of the pressure
response on a square root plot,
m(p) vs.
. We fit a straight line and deduce
. If we
know k we can then get Xmf, and from our guess of the number of fractures N we can get Xf.
Based on the available data we have determined the zone of linear flow and performed a
straight line match. We get:
Square root plot
0
2E+19
4E+19
6E+19
8E+19
1E+20
1.2E+20
1.4E+20
1.6E+20
0
1000
2000
3000
4000
5000
6000
7000
[m(pi) - m(pwf)]/q
square root of time
Linear flow detection by square root plot