Basic HTML Version


OH – ST - ET: Analysis of Dynamic Data in Shale Gas Reservoirs – Part 2
p 4/18
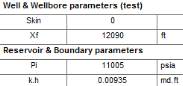
We have one equation and 3 unknowns: k, N – the number of fractures, and Xf. If we use k =
9.35e-5 md from preliminary studies, we get us an estimate Xmf = 12090 ft. For N = 42
fractures this gets us to Xf = 288 ft. The history and loglog matches are shown below:
History and Loglog match
Aside from the early time match which is not representative of the system as we have said
before, the match in general is reasonable, even using this very simple linear flow geometry.
0
10000
20000
Gas rate [Mscf/D]
0
5E+8
1E+9
1.5E+9
Gas volume [scf]
qg
Qg
qg model
Qg model
0
1000
2000
3000
4000
5000
6000
Time [hr]
4000
9000
Pressure [psia]
Pi
p
Production history plot (Gas rate [Mscf/D], Pressure [psia] vs Time [hr])
1
10
100
1000
Time [hr]
1E+5
1E+6
Gas potential [psi2/cp]
Integral of normalized pressure
Integral of normalized pressure Derivative
Loglog plot: Int[(m(pi)-m(p))/q]/te and d[Int[(m(pi)-m(p))/q]/te]/dln(te) [psi2/cp] vs te [hr]