Page 13 - Emeraude 2.60 Tutorial
Basic HTML Version


Emeraude v2.60 – Doc v2.60.01 - © KAPPA 1988-2010
Guided Interpretation #1
•
B01 - 11/38
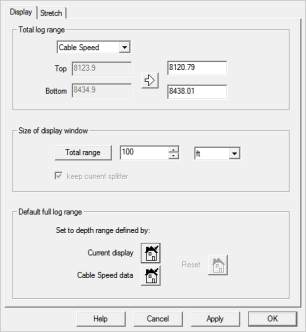
Fig. B01.12 • Depth Scale dialog
You can scroll the log using the scroll bar on the right of the plots. By default the scroll is
complete: all channels scroll together. For less powerful machines, you can use the fast scroll
option (accessible in the ‘Display’ menu, selecting the ‘Scroll’ option). In this mode, only the
depth scale and the zones visualisation (described later) are scrolled continuously. The other
channels are only updated when the scroll is over, i.e. the mouse button is released.
At the top of the scroll bar is a thin rectangle, the splitter handle: you can slide
this handle down to split vertically the display window in two parts. Each part can
be scrolled independently, allowing two separate regions of the log to be viewed at
the same time. The splitter is removed by dragging the splitter handle to the top
or bottom of the scroll bar. Up to 16 splits can be made simultaneously.
Display toolbar
Dragging its title bar above the plotting area can hide a plot. A hidden plot appears in the drop
list of the Display toolbar and can be retrieved later from this drop list. The ‘Display’ option
allows setting the document display settings. The ‘Tile’ option optimizes the use of the full
window width, dividing the available space equally between the displayed plots. Only the depth
scale and the zone visualisation plot (described later) keep their size. The well sketch view also
keeps its size by default, but this can be changed in the well sketch view properties dialog,
accessed via the view popup menu. The ‘Refresh’ icon is used to refresh the screen if needed
(only when symbols are used). Views can be shown/hidden using the ‘Show/hide views’ option.

