Page 139 - Emeraude 2.60 Tutorial
Basic HTML Version
Emeraude v2.60 – Doc v2.60.01 - © KAPPA 1988-2010
Guided Interpretation #7
•
B07 - 5/9
B07.2.4 • Plotting
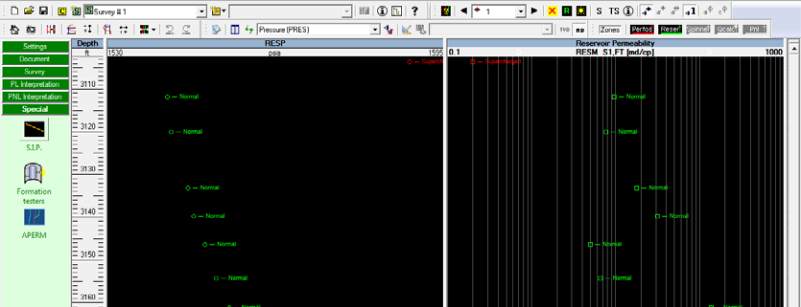
The Formation tester option automatically creates views to display the reservoir
permeability/mobility and pressure. On this views the channels appear with markers, with their
label, and each point is displayed with a color representative of its status (green=good,
orange=medium, red=bad). The reservoir pressure is displayed on a standard linear scale
while the reservoir permeability/mobility track view has a logarithmic scale.
¾
Exit the ‘Formation testers’ dialog with OK, and organize (Tile) the Emeraude main display
as in the figure below:
Fig. B07.8 • Formation tester plots
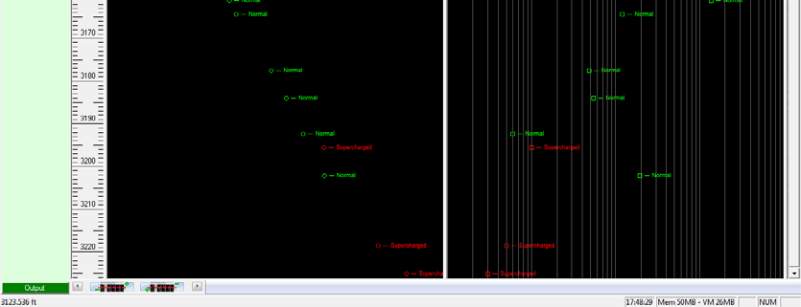
If the survey contains others permeability/mobility channels, they will also appear on the view
as seen in Fig. B07.9 (white curve).
¾
From the ‘Survey’ control panel, open the ‘Load’ option and import the ‘B07oh.las’.
This file includes a permeability curve from a previous open-hole logging session. This curve
appears on the same track as the loaded mobility curve.
¾
Make the permeability curve active (clicking on curve name in header) and reset the
horizontal scale from 0.1 to 1000 in order to show the logarithmic scale vertical lines (the
same scale is required for both channels).
Note: you can modify the Plot and lines aspects in the dialog accessible in the control Panel
Settings Default Display, in the tab Views / Formation testers views.

