Page 140 - Emeraude 2.60 Tutorial
Basic HTML Version

Emeraude v2.60 – Doc v2.60.01 - © KAPPA 1988-2010
Guided Interpretation #7
•
B07 - 6/9
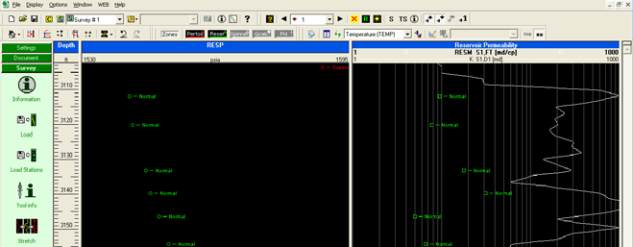
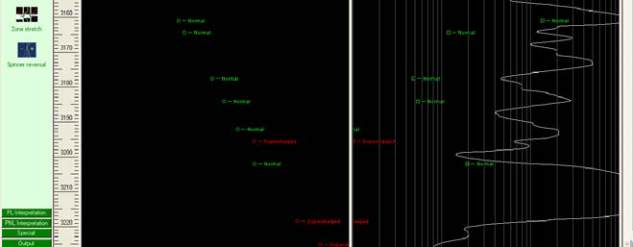
Fig. B07.9 • Formation testers plots and Open-hole permeability
B07.2.5 • Defining the gradients and contacts
¾
Go back to the ‘Formation testers’ main dialog.
Once the linearities have been decided on the screen, it is possible to create lines, by least
square, or by drawing on the reservoir pressure view. Provision has been made for an
unlimited number of layers, and within each layer for three lines representative of water, oil,
and gas. In this session, it is assumed that the well is vertical and therefore we do not worry
about deviation/TVD. If the well was deviated, and with loaded data supplied versus MD, you
should load a TVD channel in the General Well Data (using the ‘Load Well Data’ option of the
‘Document’ panel). Once the TVD channel is loaded, the display can be dynamically switched to
TVD using the last 2 icons of the Display toolbar:
At startup, only one layer is created but you can add as many as required
clicking on the button next to the layer drop list. For a given layer, the 3 lines
for gas, oil, and water are created, modified, or deleted using the
corresponding buttons as seen in opposite.
When selecting ‘Regression’ ‘Draw’ or ‘Modify’, the dialog is hidden and the
operation is conducted directly on the formation pressure view as follows:
¾
Regression: click for the first limit, drag, and then release for the second limit. After the
range is selected a dialog pops up that gives the option to either select all the points, the
good only, or the good + medium only.
¾
Draw: click for the start point of the line, drag and then release for the end point.
¾
Modify: a central cursor can be seized that moves the line up and down. At each extremity,
two more cursors can be grabbed to rotate the line.

