Page 141 - Emeraude 2.60 Tutorial
Basic HTML Version
Emeraude v2.60 – Doc v2.60.01 - © KAPPA 1988-2010
Guided Interpretation #7
•
B07 - 7/9
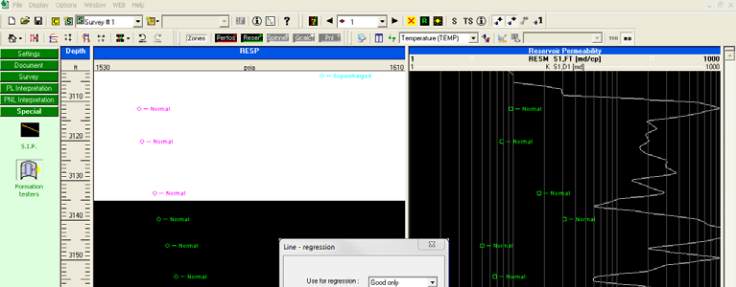
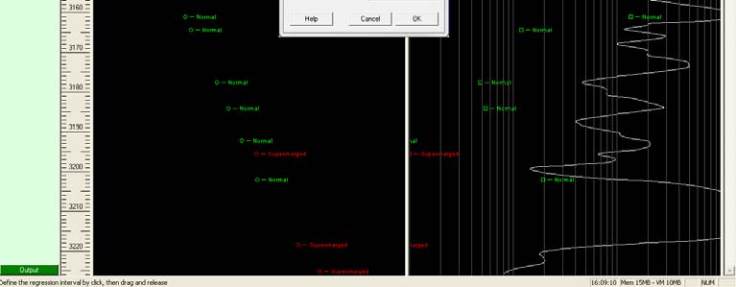
In order to define the gas pressure gradient, pick the ‘Red line’ icon and select the ‘Regression’
option; compute the line from 3103 ft to 3135 ft:
Fig. B07.10 • Defining the gas gradient
¾
Select the ‘good only’ points.
¾
Exit with OK.
The ‘Formation testers’ dialog pops up back on the screen and a red line corresponding to the
computed gradient is being drawn. The results are seen in the lower part of the dialog, with a
section where a name can be given to the line.
¾
Type in ‘Gas’, as seen below.
Fig. B07.11 • Lines section for Gas
Next to the line name is the indication of the scale where the line was created (MD or TVD).
The slope is the actual slope on the line native scale. The vertical gradient is either the slope, if
the line is created versus TVD, or the actual slope divided by the cosine of the average
deviation in the line interval otherwise. Once again, let us insist on the fact that if the deviation
is significant and not constant, you should load a TVD channel in the General Well Data, and
toggle the display to TVD before defining the lines.
For a line defined by regression, R2, the determination coefficient is displayed. Recall that a
value of 1 is indicative of a good fit, whereas 0 is the opposite. To change the line, you can
select among the following options:

