Page 162 - Emeraude 2.60 Tutorial
Basic HTML Version
Emeraude v2.60 – Doc v2.60.01 - © KAPPA 1988-2010
Guided Interpretation #8 • B08 - 18/25
A number of new views have been created, some appearing automatically in the layout up to the
usual limit. Automatic views are created for the averages, and a global error view called ‘MPT
Errors’ + Interpretation short name is create to display the overall errors on reconstructed tools.
Use the hide/show view dialog to organize the layout with:
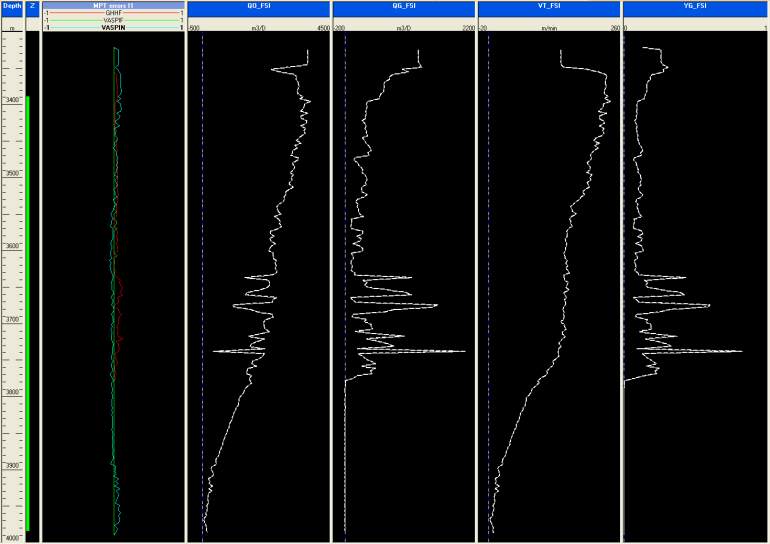
[Depth – Z – MPT errors I1 – QO_FSI – QG_FSI – VT_FSI – YG_FSI]
Add the corresponding snapshot ‘Processing’.
Fig. B08.23 • ‘Processing’ snapshot
The error view shows that:
-
The VASPIF curve is close or equal to 0 over the entire log interval: the FSI spinner
velocities are almost matched with no error, except at depths where a spinner is at the
same position in both passes, but reads a different value. The combined process then sets
the model to the average value. Otherwise, no difference is found between raw and
reconstructed, because of the linear model with no central spinner constraint.
-
The GHHF are further - more on this later.
-
VASPIN, the error on the central spinner measurement is not far. Note that the
reconstructed value is an average of the 2D model on the disk of radius spinner blades
diameter.
The other views are displaying MPT averages (dashed lines from calculated log data node) and
Interpretation inputs (continuous line). Curves are identical because of the combined process. The
results obtained are erratic (spikes) due to few valid measures and the instable flow in the well.
We take a further look at the results. The newly generated channels (reconstructed, errors) can
also be seen on the automatic views.

