Page 165 - Emeraude 2.60 Tutorial
Basic HTML Version
Emeraude v2.60 – Doc v2.60.01 - © KAPPA 1988-2010
Guided Interpretation #8 • B08 - 21/25
probes automatic views, with a white dash line aspect by default (for instance, you would see
those by calling the FSI optical probe view snapshot, and asking for the display of the MPT
processed channels).
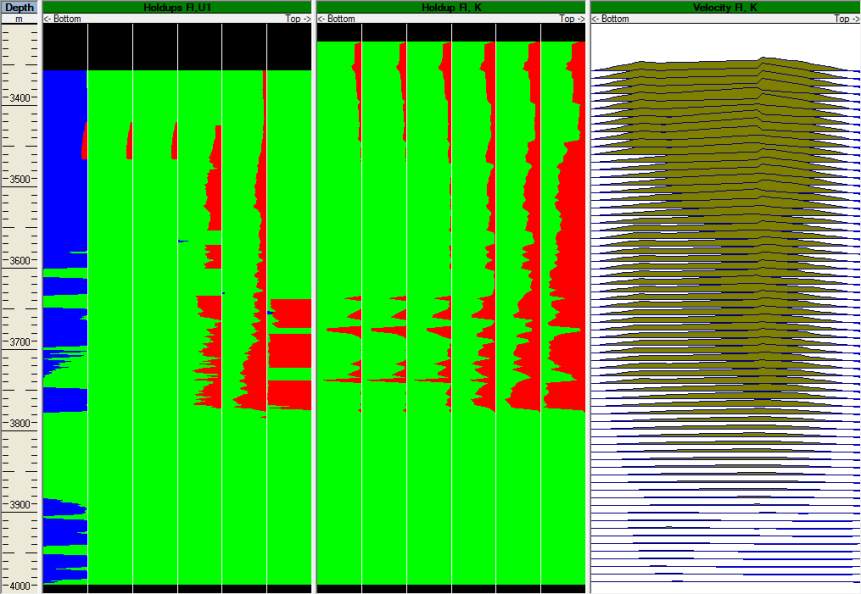
You can also create a velocity view to display the reconstructed data: select the New image
view option in the browser, check the ‘Velocity’ box in the Image views properties dialog,
select ‘Reconstructed’ and ‘Combined passes’, and change the view title to ‘Velocity Fl, K’.
You can create a snapshot called ‘Holdups’.
We clearly see on the holdup views the result of the model application: Yw=0 and the influence of
the stratification imposed by Mapflo model on the gas holdup (although not forced to honor
gravity segregation).
It can also be noticed from the velocity view that, although the raw and the reconstructed
velocities are almost identical over the entire log depth (linear model with no central spinner
constraint), the reconstructed velocity profile is different from the raw velocity profile (you can
create a raw velocity view for pass Up1 to see the difference). The Combined processing option is
responsible for this difference, and it is actually recommended to use the Prandtl velocity model
when a Combined processing is run on the FSI tool. This generally ends up with more admissible
profiles in a physical sense, although phase desappearance or tool rotation may sometimes be
responsible for a clearly erroneous profile (generally clearly identifiable).
Fig. B08.27 • Holdup image views: raw and reconstructed with a velocity view
Let us call the cross-section of the reconstructed holdup view using the combined passes.

