Page 166 - Emeraude 2.60 Tutorial
Basic HTML Version
Emeraude v2.60 – Doc v2.60.01 - © KAPPA 1988-2010
Guided Interpretation #8 • B08 - 22/25
Right click on the image view ‘Holdup Fl, K’ and select Cross-section.
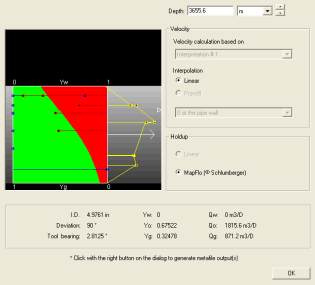
The following window pops up. The cross-section depth changes when pressing shift and moving
the mouse on top of the image view.
Fig. B08.28 • Image view cross-section
The different options are locked on the MPT model. The blue squares represent the electrical
probe raw measurements (DFHF mnemonics - water holdups). The red squares represent the
optical probe raw measurements (GHHF mnemonics - gas holdups). The red area represents the
gas holdup given by the Mapflo model from bottom to top, the green area the oil holdup. The
yellow squares represent the raw spinner apparent velocities, and the yellow line represents the
velocity profile from the MPT model.
B08.4 PL • Interpretation
As mentioned earlier, having checked ‘Average of the outputs’ in the MPT processing window,
Emeraude has generated copies of the MPT process averages for the interpretation inputs.
Go to the PL Interpretation Information – Reference channels: the MPT process averages are
visible.
Define the reference Temperature and Pressure from pass Up1.
As opposed to the usual zoned approach where the residual calculations are made at the
calculation zones only, a continuous approach, offered as an alternative, considers all schematic
points when calculating the objective function and allows the holdups to slightly depart from the
slip model predictions.

