Page 178 - Emeraude 2.60 Tutorial
Basic HTML Version

Emeraude v2.60 – Doc v2.60 - © KAPPA 1988-2010
Guided Interpretation #9 • B09 - 8/22
B09.2.3 • Basic Sensors Display
¾
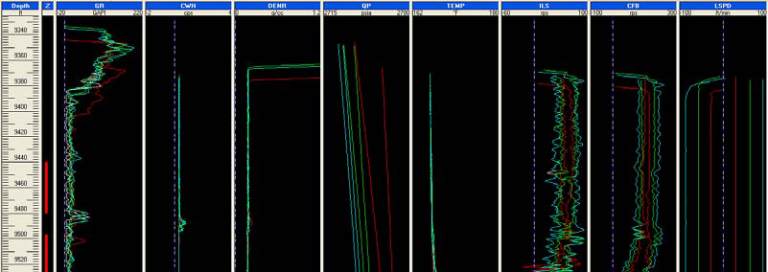
Display the basic sensor measurements GR, CWH, DENR, QP, TEMP, ILS, CFB, LSPD
with the zone display.
¾
Create the corresponding snapshot ‘Basic sensors’.
Fig. B09.9 • Basic sensors display
The capacitance and the density tools are confirming the water at the very bottom, oil just
above water and gas all the way up, assessing the measurements of the CAT and RAT. In
addition, the capacitance tool sees an entry around 9490 ft, like the RAT and CAT.
Note that, since the beginning, snapshots have been created although there was no existing
interpretation. Such snapshots are labeled with the survey short name preceeding their name
(e.g. ‘[S1] CAT N probes’). They will be available for any interpretation created later. If such a
snapshot is modified by adding a view created under an interpretation or containing
interpretation dependent data, the snapshot name will change with the short name of the
interpretation replacing the short name of the survey (e.g. ‘[I1] CAT N probes’). Such a
snapshot will then only be available when Interpretation I1 is active. This will be illustrated
below when dealing with the SAT data.

