Page 25 - Emeraude 2.60 Tutorial
Basic HTML Version

Emeraude v2.60 – Doc v2.60.01 - © KAPPA 1988-2010
Guided Interpretation #1
•
B01 - 23/38
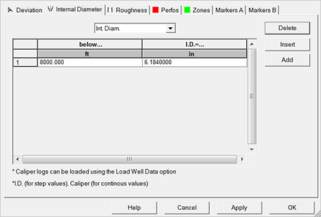
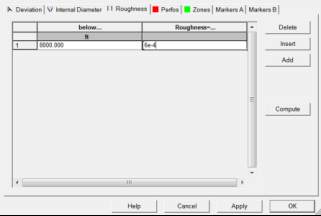
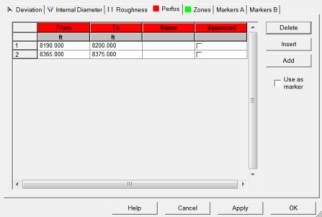
Fig. B01.27 • I.D. / Roughness / Perfos
Validate with OK.
A new plot named ‘ID’ is created and displayed, as well as a track labelled ‘Z’ with the perfos
indicated using red markers.
Hide the ID plot by dragging its title bar outside the plotting area.
To enlarge the Z track, position the mouse above the right border of the Z view, click and
drag the right border to the right.
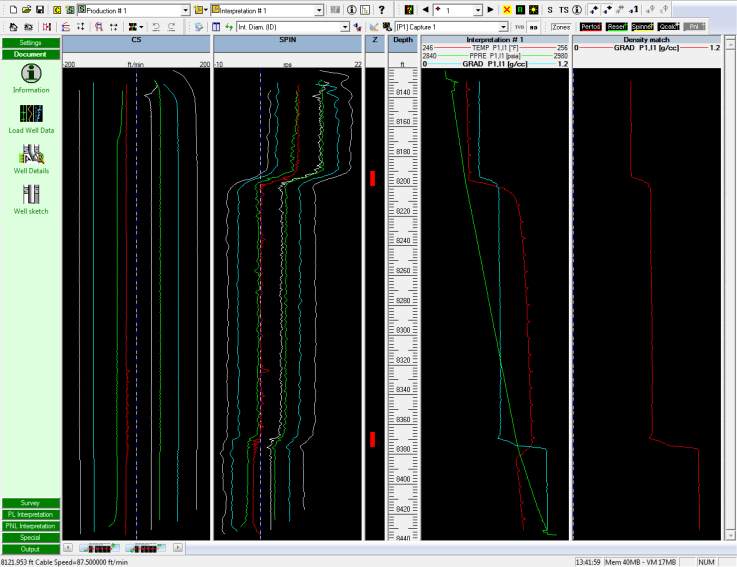
Move the view to the left of the Depth track, and Tile the plots: Fig. B01.28.
Fig. B01.28 • General Well data entered
A note on Reservoir Zones:
Reservoir zones present in the ‘Well Details’ dialog are distinct from the perforated interval and
they are used to materialize the actual reservoir(s). The reservoir zones are displayed with
green markers by default and are only used in SIP analysis. For all other purposes they are for
visual illustration. The aspect of all zones (perfos, reservoir, etc) can be modified in the
‘Document Display Settings’, which can be accessed via the
icon in the display toolbar,
under the ‘General/Zone colors’ item.

