Page 33 - Emeraude 2.60 Tutorial
Basic HTML Version
Emeraude v2.60 – Doc v2.60.01 - © KAPPA 1988-2010
Guided Interpretation #1
•
B01 - 31/38
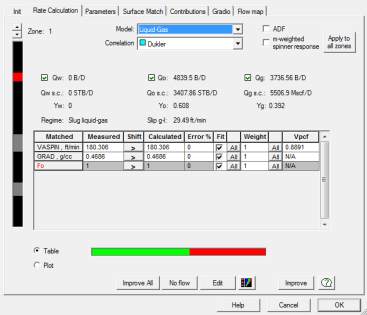
Fig. B01.37 • Rate calculation dialog
The values displayed in the dialog correspond to a given calculation zone. Similar to the
spinner calibration dialog, a small schematic shows the active zone and can be used to change
the zone under investigation.
For Liquid-Gas flow, a model is basically the conjunction of two main components: a flow
regime map and a slippage (or holdup) correlation for each regime. For any couple of rate
values (gas and liquid rates), the flow model can be used to predict the flow regime, the
slippage value and thus the phase holdups. Given the holdup, and knowing individual densities
from the PVT model the mixture density is calculated. Knowing the transfer function of the
density tool used (possibly involving frictions and deviation) it is possible to compute the
theoretical value that the density tool should read, assuming this flow model. Similarly, it is
possible to compute an expected value of apparent velocity and practically this is done by
estimating the value of a correction factor, Vpcf=Vm/Vapp.
To summarize, for any assumption of the rates at a given depth, and any flow correlation, we
can calculate the simulated apparent velocity, and the simulated density. Emeraude can then
run a non-linear regression in order to match measured and simulated values. The displayed
values of rates result from this calculation. The bottom table indicates the measured and
simulated values.
Note the green checks in front of the Qw, Qo, and Qg buttons, they mean that all three rates
were variables. Only 2 measurements were however available and Emeraude had to consider a
third information for closure. This third value is listed in red in the table, and is ‘Fo’, the oil
fraction in the liquid rate. The current value of 1 is a default and means that there is no water;
this corresponds to our assumption.

