Page 35 - Emeraude 2.60 Tutorial
Basic HTML Version
Emeraude v2.60 – Doc v2.60.01 - © KAPPA 1988-2010
Guided Interpretation #1
•
B01 - 33/38
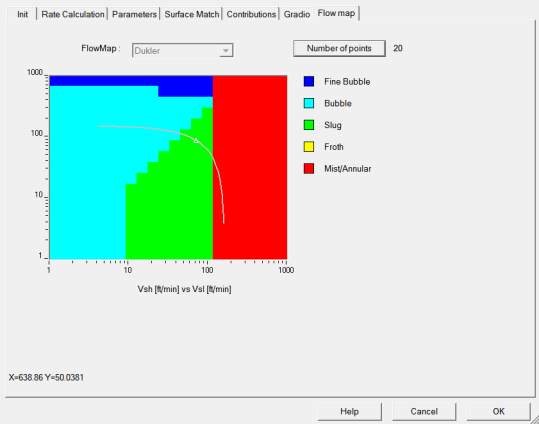
Fig. B01.39 • Flow map
The flowmap is presented in terms of superficial velocities Vsh and Vsl. Superficial velocities
are defined as the rates divided by the cross section. ‘h’ refers to ‘heavy’, i.e. liquid phase
here; ‘l’ refers to ‘light’, i.e. gas phase here. The gray line on the flow map is for Vsh + Vsl =
Vm and the white triangle shows the current solution.
The resolution of the flow map may be improved by changing the number of points.
All input parameters, other than those used in the matching can be viewed in the ‘Parameters’
page. When the density tool is not a nuclear tool, the ‘Gradio’ page lists all the gradient
components.
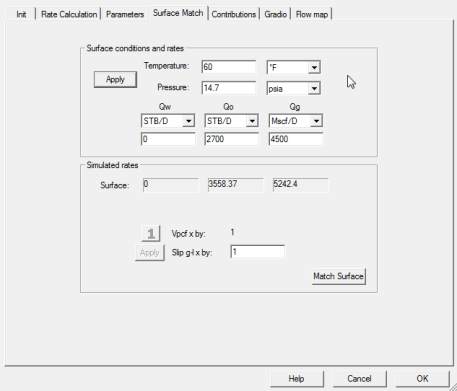
Until this stage, we have disregarded the surface conditions.
Select the ‘Surface Match’ tab Fig. B01.40.
Enter the surface rate values as
Surface oil Qo=2700 STB/D; Surface gasQg=4500MSCF/D
.
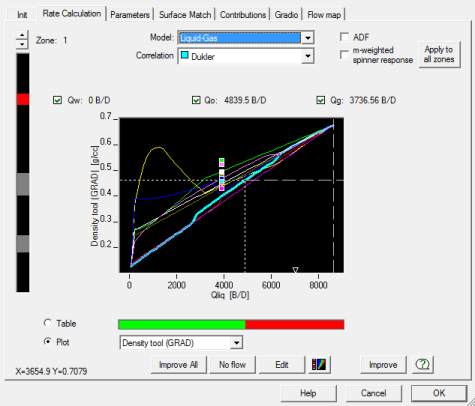
Return to the ‘Rate Calculation’ tab, and if the Plot is not currently displayed, select this
mode. Make sure also that you are looking the top zone, Fig. B01.41.
Fig. B01.40 • Surface production entered
Fig. B01.41 • Top zone; Plot mode

