Page 36 - Emeraude 2.60 Tutorial
Basic HTML Version
Emeraude v2.60 – Doc v2.60.01 - © KAPPA 1988-2010
Guided Interpretation #1
•
B01 - 34/38
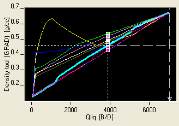
On the plot are symbols representing the surface conditions. On the X-axis a white triangle
shows the value of downhole total rate as computed from the surface rates (and the PVT
model). Colored squares indicate, for each flow correlation, the density tool response the
correlation would predict if the downhole rates were those corresponding to surface conditions.
Hence, on the plot:
- Qt does not match the Qt from surface conditions (vertical dashed line does not match the
white triangle).
- Qo/Qg do not match the surface conditions (squares are not aligned with the dotted white
line).
The difference between the simulated and measured surface rates may come from an
inaccuracy in either the data or the models used for the simulation. The second guided session
will illustrate how the data quality can be assessed using a shut-in survey. In this session there
is no further information and the assumption is made that the surface data is correct and the
accuracy of the model is questioned. Two variables can be used to modify both the slippage
correlation and the model predicting the correction factor Vpcf. These are the Vpcf multiplier
and the Vslip multiplier. These are initially equal to 1 (i.e. no change to the models).
Activate the ‘Surface Match’ tab.
Select the ‘Match Surface’ button.
Rates are set to honor the surface values. The Vpcf and Vslip multipliers are then adjusted so
that consistency is kept between measured and simulated data. When the value of the
multipliers has been obtained Emeraude automatically re-runs a non-linear regression
for all
zones
using those values. When the calculation is finished it can be seen that surface
conditions are honored and the measurements are coherent for all zones.
Return to the ‘Rate calculation’ tab. You can
check on the plot the effect of the Surface
Match, Fig. B01.42.
Select the bottom zone and click on ‘NoFlow’ to
set the mixture velocity to
0
(this will also
automatically set the water holdup to 1).
Fig B01.42 • Surface Match effect
Validate the zone rate calculation with OK. The ‘Rate Log Settings’ option of the control
panel is called directly, and the dialog in Fig. B01.43 appears.

