Page 37 - Emeraude 2.60 Tutorial
Basic HTML Version
Emeraude v2.60 – Doc v2.60.01 - © KAPPA 1988-2010
Guided Interpretation #1
•
B01 - 35/38
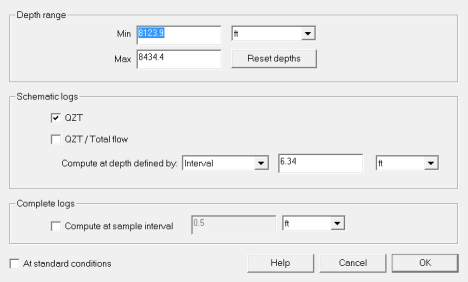
Fig. B01.43 • Log generation
The rate log can either be a schematic or the result of a complete calculation. The latter
invokes the non-linear regression scheme described earlier at every depth. This option is
described in the next section. The schematic is simply a graphical presentation of the zone
rates. Note the option to generate the schematic rate log at standard conditions rather than
the default downhole conditions.
Leave ‘Schematic’ checked and uncheck ‘Complete’. Do not change the other settings.
Validate with OK.
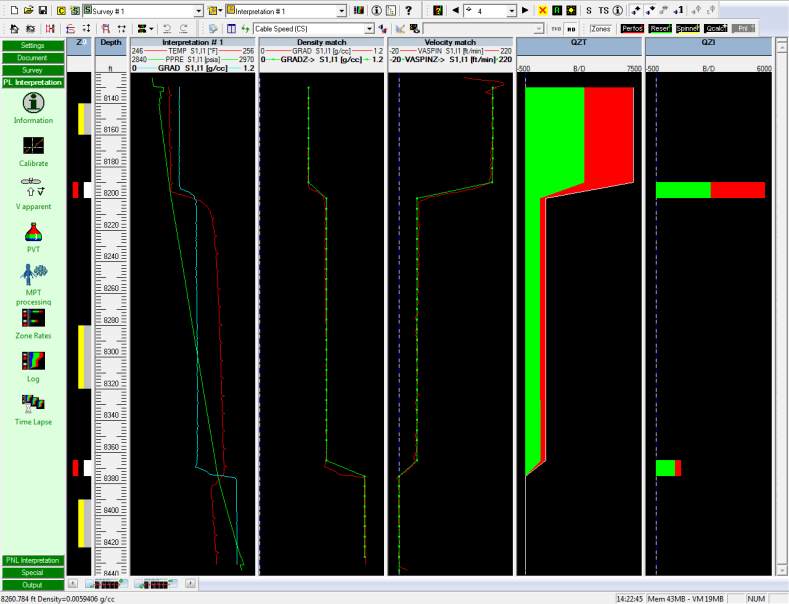
Emeraude generates 4 new logs in the interpretation: QOZT, QGZT, QOZI, QGZI. ‘O’ stands for
oil and ‘G’ for gas. ‘Z’ stands for ‘zoned’. ‘T’ stands for total (or cumulative) and ‘I’ for
incremental. Two plots are automatically added to the main screen, one for cumulative rates,
and the other for incremental contributions. The simulated density and velocity are added to
the match plots.
Fig. B01.44 • Schematic calculated

