Page 45 - Emeraude 2.60 Tutorial
Basic HTML Version
Emeraude v2.60 – Doc v2.60.01 - © KAPPA 1988-2010
Guided Interpretation #2
•
B02 - 5/22
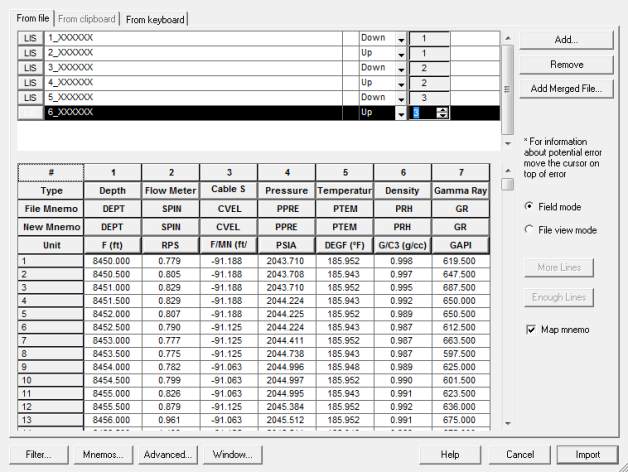
Fig. B02.4 • Production logical files: pass type + number edited
Select ‘Import’. The survey data is displayed automatically for the entire data range.
Right-click on the Gamma Ray plot.
Select ‘Horizontal scale’ and reset the ‘Full log range’. Click OK.
This plot existed before the current load (open-hole gamma-ray in Well Data) and the scale
was not reset automatically. The open-hole gamma-ray (GROH changed to GR), is plotted
together with new GR survey data.
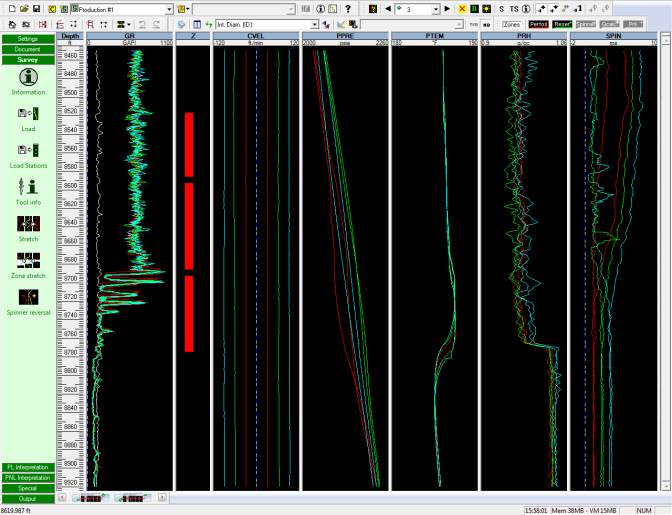
Hide the ID plot by dragging its title bar outside the plot area and select ‘Tile’, Fig. B02.5.
Fig. B02.5 • Production data loaded: Gamma ray plot rescaled: ID hidden

