Page 52 - Emeraude 2.60 Tutorial
Basic HTML Version
Emeraude v2.60 – Doc v2.60.01 - © KAPPA 1988-2010
Guided Interpretation #2
•
B02 - 12/22
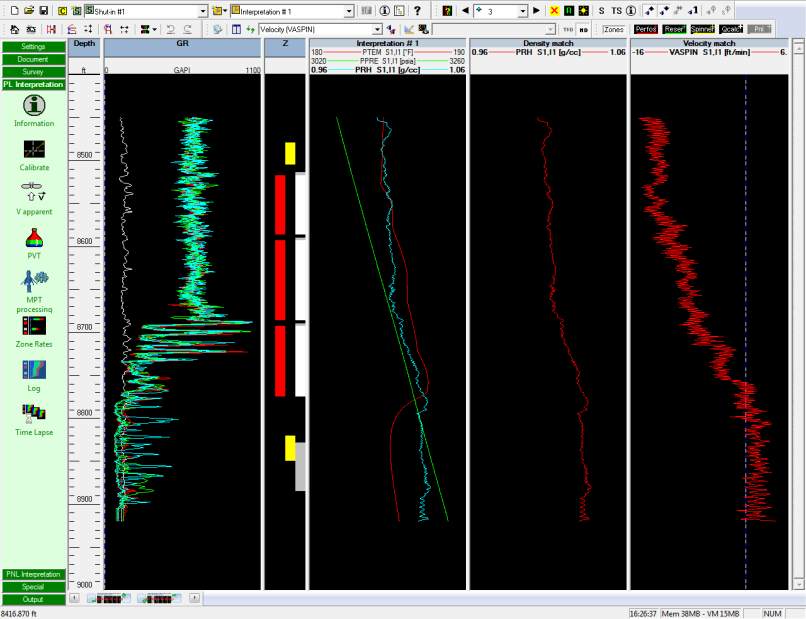
Fig. B02.15 • Bottom calculation zone moved down and extended
Select ‘Zone Rates’.
The ‘Init’ page is displayed and a flow model and correlation must be defined. There are two
possible choices with the selected PVT model: Liquid-Gas or Water-Hydrocarbons (L). The
second model is the default as we only have a density measurement. Furthermore, we know
from the saturation pressure and producing GOR that no gas is present during the build-up.
Accept the default model and correlation, and click on the ‘Rate Calculation’ tab.
The main objective of analyzing this shut-in data is to check the density tool reading in a
known fluid type by comparing measured density with predicted values. The density tool
(except for a nuclear tool) does not output the straight density value, but some function of
it; therefore we cannot simply compare PVT predicted densities and tool readings. The zone
rate dialog gives the option to see predicted tool response in 100% oil or 100% water. You
can do this as follows:
Make the bottom zone active, by clicking on the zone in the schematic to the left of the plot,
or use the small arrows above that schematic to move to the required zone.
If Qo is not 0, click on Edit and set it to 0 (Qg is disabled with this particular model
as p > pb).
Set the page to ‘Plot’ mode.
Zoom in (with a right-click on the plot) as shown on the figure below:

