Page 53 - Emeraude 2.60 Tutorial
Basic HTML Version
Emeraude v2.60 – Doc v2.60.01 - © KAPPA 1988-2010
Guided Interpretation #2
•
B02 - 13/22
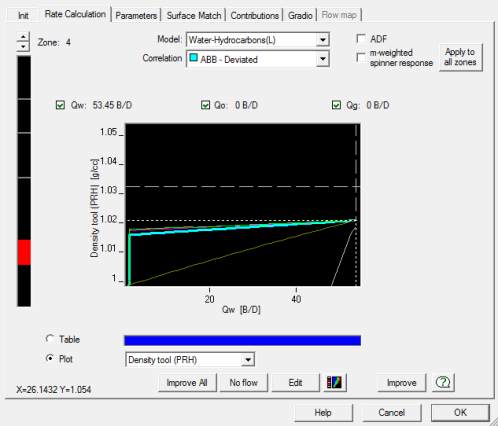
Fig. B02.16 • Zoom in for bottom zone after setting 100% water
The current solution is for single-phase water and the predicted density tool response should
be at most equal to the measured density. This is not the case here and if we trust the PVT we
may decide to offset the measured density channel.
Note: Depending on the position of the bottom calculation zone the apparent velocity for this
zone will be positive or negative. When it is negative, the slippage for all correlations is 0 and
they are displayed as a straight line. When Vapp is positive, some correlation may predict a
slippage values much bigger than the current Vm. Here we simply look at single-phase
situations, and this is not a problem. However a maximum limit for the ratio of the slippage to
the mixture velocity can be set in the ‘Vslip/Vm’ option in the ‘Edit’ dialog (leave the field
empty for no limit).
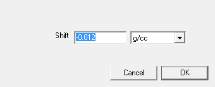
Revert to ‘Table’ mode.
Click on the ‘
>
’
button of the Density (PRH) line to shift the measured value, Fig. B02.17.
Fig. B02.17 • Shifting the reference density
The interpretation reference density has been shifted by -0.012 g/cc (
your value could be
different depending on your calculation zones).
It can be that measured and simulated values
now coincide.
Exit the ‘Zone rates’ dialog. Do not generate logs, press ‘Cancel’.
The applied shift can be later viewed/edited inside the data browser. Right-click on ‘Density’ to
select ‘Edit / create channel’, pick the ‘y->a.y+b’ option as illustrated below:

