Page 55 - Emeraude 2.60 Tutorial
Basic HTML Version

Emeraude v2.60 – Doc v2.60.01 - © KAPPA 1988-2010
Guided Interpretation #2
•
B02 - 15/22
In the ‘Reference channels’ tab of the ‘Interpretation Settings’ dialog define the temperature
and pressure interpretations as:
Temperature: Down1.
Pressure: average all except Up 1 and Down 1.
Density: average all except Up3 and Down3.
Create a user view in the browser that contains the flowing and Shut-in reference density.
To do this:
Open the data browser, click on the node ‘production #1’.
Select the user view creation icon
(or right-click in the browser and in the popup menu
select create User view). A new empty view appears on the screen (right-hand side).
Scroll in the tree view and open nodes as necessary to select the PRH channel inside the
Shut-in Interpretation.
Drag it and drop it on the newly created user view.
Do the same with the PRH channel in the Production Interpretation.
Tile the tracks.
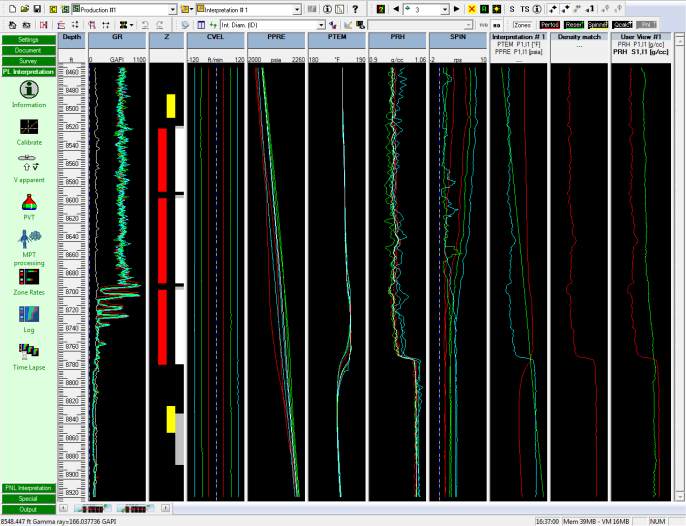
Fig. B02.20 • Production reference channels defined; user view created
By overlaying the shut-in and flowing densities one can see that there is a difference between
them below 8800 ft. To check this difference you can maximize the newly created user view by
a double-click on its title bar. The value of the difference can be found reading the mouse
coordinates in the status bar while moving the cursor on top of them inside the view.
Note that
for a user view, the displayed scale corresponds to the active channel in the view. This active
channel, in bold in the header, can be changed by clicking directly inside the header.
If you maximized the user view, double-click once again on its title bar to restore the
previous position and screen layout.

