Page 61 - Emeraude 2.60 Tutorial
Basic HTML Version

Emeraude v2.60 – Doc v2.60.01 - © KAPPA 1988-2010
Guided Interpretation #2
•
B02 - 21/22
B02.5
4B
• Additional editing features
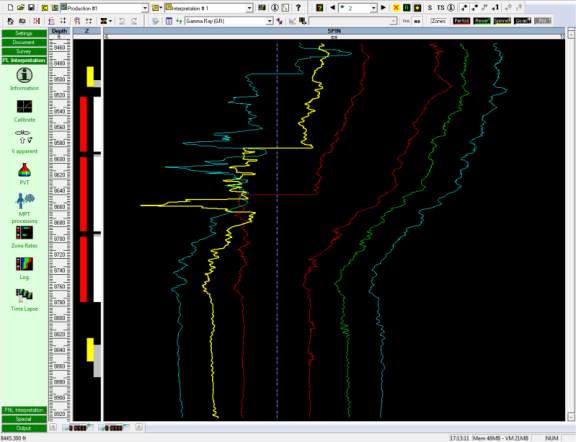
Fig. B02.29 illustrates the SPIN plot of the up and down passes during the production phase,
the three up passes (the three leftmost curves) have several kinks around 8600 ft. In this
chapter we will illustrate how this can easily be edited and deleted.
Fig. B02.29 • Spinner response with noise
Interactive Editing
Make sure the SPIN log is displayed (if not get it back from the pass drop list).
Activate pass Up2 and highlight it.
Get the SPIN plot to full page by double clicking on its header, as on the figure above.
Open the Data Browser.
Resize it so that both the Browser and the SPIN plot can be seen on the screen.
Select the SPIN channel in the pass Up2, Production #1, Log Data, Up2.
Select the ‘Edit / create channel’ and ‘Interactive’ options of the browser pop-up (or
).
Note that the edit option applies to the current selection.
Directly click on the curve to edit it, interpolate the values as indicated in Fig. B02.30.
When finished click OK.

