Tutorial 1: Cumulative Production User task#
If the user is unfamiliar with the concept of user tasks in KAPPA-Automate, we encourage the reader to browse the section on User Task or User tasks in the KAPPA-Automate help.
Let’s get started#
In this example, we will create a user task to calculate the cumulative gas production from input gas rate. Although the calculation is simple, we can use this example to demonstrate a great deal of sophisticated functionality which is available.
The script that will perform the calculation will be written in Python. But before we start writing the script, we will first define the input and output in the user interface. Fig. 1 below shows snapshots of the KAPPA-Automate (KAPPA-Automate) toolbar.

Fig. 1 Select the blue “Automation” icon on the right toolbar to configure, create and edit user tasks, plot templates, simple functions, etc.#
Selecting the blue “Automation” icon and then the “User tasks” menu on the left-hand side will show a list of user tasks and icons to create/edit/view/duplicate/delete user tasks (Fig. 2 below).
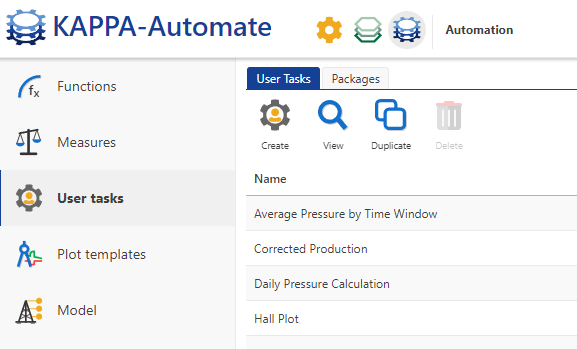
Fig. 2 Select the “User tasks” menu to create/edit user tasks and packages.#
Clicking on “Create” will open a user interface where the user can define a new user task. This UI has four tabbed panes. The first pane (Fig. 3) is a general pane where the user provides general information about the user task.
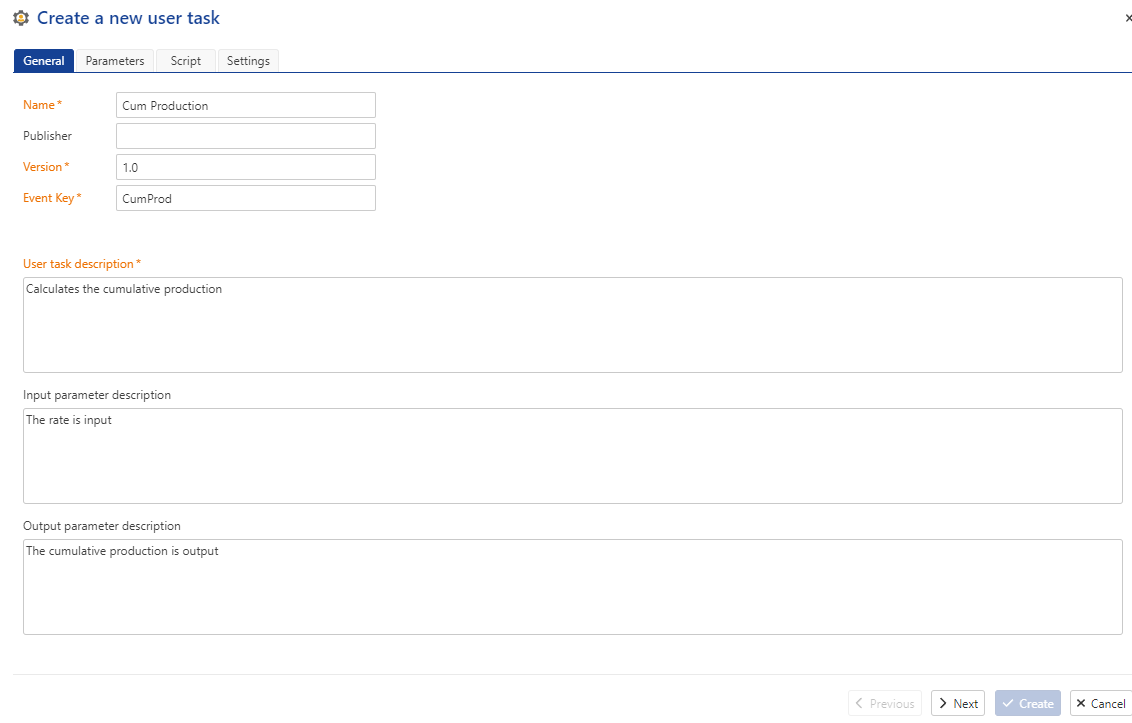
Fig. 3 The “General” pane is where the user provides the name of the user taskand a description of the input and output which may help in understanding the functionality of the task for other interested parties. The “Event Key” is a required entry but is not essential for this tutorial.#
For this simple tutorial, we have only one input (the gas rate) and one output (the gas production), as shown below (Fig. 4).
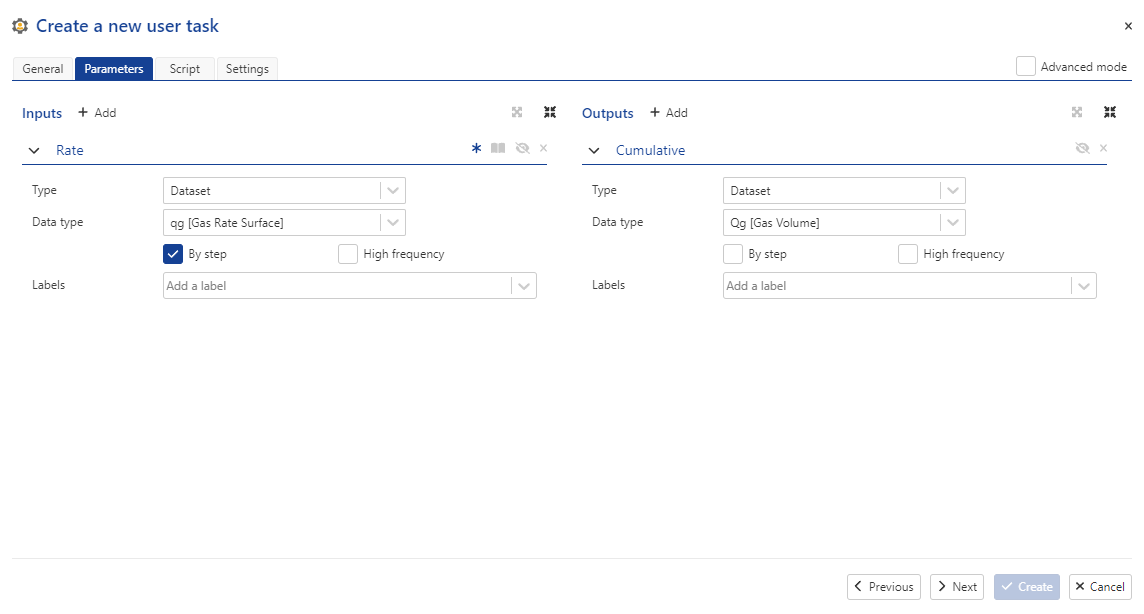
Fig. 4 The “Parameters” tabbed pane is where the user task creator defines the mandatory and optional input and output of the user task.#
The scripting language can be either Python or C#. For this tutorialand for most of the KAPPA-Automate Extension Guide, we focus on the use of Python. Note that the task we will write will not require any external Python packages - using external packages will be the subject of the next tutorial.
Your first Python user task#
Important
All user tasks should start with the import of services from kappa_sdk.user_tasks.user_task_environment
from kappa_sdk import Connection
The above statement imports kappa_sdk.user_tasks.Services class which has an instance within the user task.
This class provides access to user task input and output, as well as objects that read and write, loggingand many other objects that we will discover in the tutorial.
In this particular example, we will calculate the cumulative production from an input rate dataset.
To start, we will log a message that the user task is starting. Then, we will recover the inputs like the ID of the vector which contains the rate data, the ID of the vector which will contain the output cumulative production and the other inputs.
print('Connecting to {}'.format(ka_server_address))
connection = Connection(ka_server_address, verify_ssl=False)

field_name = 'SPE RTA Demo'
The rate_vector_id variable contains the unique identifier for the input rate, which is defined when creating the user task for the well. To obtain the actual data, we use the following two lines below in Listing 4. In the first line, we use the kappa_sdk.user_tasks.Services instance to obtain a reference to the well under which the user task is found, then call the method kappa_sdk.Well.find_gauge_by_id(). This returns an instance of kappa_sdk.Data. The second line uses kappa_sdk.Data.read() to obtain a kappa_sdk.Vector instance which encapsulates the data (dates, elapsed times, rates).
 rate_data = services.well.find_gauge_by_id(rate_vector_id)
 rate_vector = rate_data.read()
Then we can obtain the dates, calculated elapsed timesand rate values in the following manner (Listing 5).
 dates = rate_vector.dates
 times = rate_vector.elapsed_times
 values = rate_vector.values
For rate data stored in steps, the values are given at the end of the time step. So, we can calculate the cumulative production as shown in Listing 6.
 cum_prod: List[float] = list()
 date_list: List[datetime] = list()
 cum_prod.append(0)
 date_list.append(rate_data.first_x)
 first_delta = (dates[0] - rate_data.first_x).total_seconds()
 cum_prod.append(first_delta * values[0])

 for i in range(1, len(times)):
     delta_t = times[i] - times[i - 1]
     delta_t_seconds = delta_t * 3600.0
     cum_prod.append(delta_t_seconds * values[i] + cum_prod[-1])
 date_list.extend(dates)
Note that the cumulative production is stored as point data, so we must add the values at time=0, which corresponds to rate_data.first_x. Time is stored in hours, but the rates (and all other values in KAPPA-Automate) are stored in SI units, so we must convert the time to seconds when calculating the cumulative production. The variable date_list is necessary for storing the output to the well, which is done in the final line of the task below using an instance of kappa_sdk.user_tasks.DataCommandService, obtained from the kappa_sdk.user_tasks.Services instance. In the code block below, we use the ID of the cumulative production vector.
services.data_command_service.replace_data(cumulative_vector_id, date_list, cum_prod)
The method kappa_sdk.user_tasks.DataCommandService.replace_data() will replace the previously calculated cumulative production with what is in cum_prod.
This first user task example is repeated in its entirety in Listing 7.
 1 from kappa_sdk.user_tasks.user_task_environment import services
 2
 3 services.log.info('Start of cumulative production calculation user task')  # <== Add logs to follow your code
 4
 5 rate_vector_id = str(services.parameters.input['Rate'])  # <== This is how we obtain the ID of the input rate vector
 6 cumulative_vector_id = str(services.parameters.output['Cumulative'])
 7
 8 rate_data = services.well.find_gauge_by_id(rate_vector_id)  # <== This is one way of obtaining a Data instance
 9 rate_vector = rate_data.read()  # <== Here we get the actual dates/times/values of the rates
10
11 dates = rate_vector.dates
12 times = rate_vector.elapsed_times
13 values = rate_vector.values  # <== Rates are in SI units m^3/s
14
15 cum_prod: List[float] = list()
16 date_list: List[datetime] = list()
17 cum_prod.append(0)
18 date_list.append(rate_data.first_x)
19 first_delta = (dates[0] - rate_data.first_x).total_seconds()
20 cum_prod.append(first_delta * values[0])
21
22     #  Calculate the cumulative production
23 for i in range(1, len(times)):
24     delta_t = times[i] - times[i - 1]
25     delta_t_seconds = delta_t * 3600.0
26     cum_prod.append(delta_t_seconds * values[i] + cum_prod[-1])
27 date_list.extend(dates)
28
29 services.data_command_service.replace_data(cumulative_vector_id, date_list, cum_prod)  # <== Here we write the cumulative production to KAPPA-Automate
Copy and paste Python script in Listing 7 in the user task creation UI in the text area of the “Script” tabbed pane (Fig. 5). Select the “Validate” button and create the user task. Note that there is a fourth tab in the user task UI titled “Settings”, which we will touch upon in a subsequent tutorial.
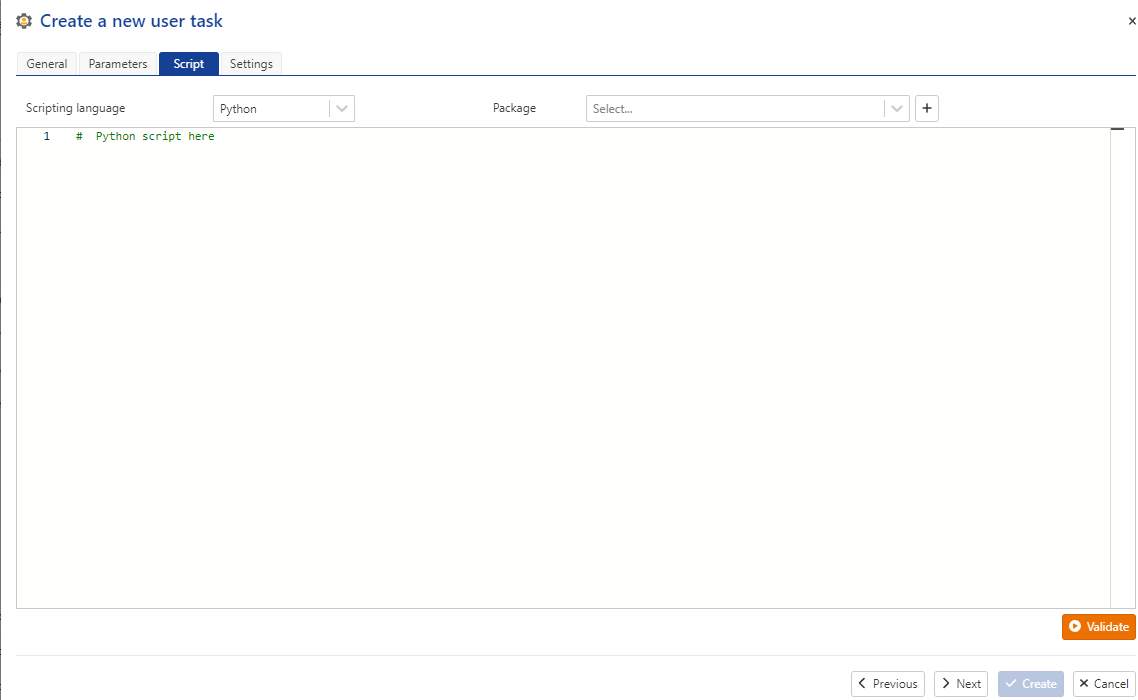
Fig. 5 The “Script” tabbed pane is where the user task script (in Python or C#) is found. It is also where the required packages for the script are defined.#
You are now ready to deploy your new user task to any well which contains gas production. Below, we describe how to create a user task for a well. This is also described in the User tasks section of the help.
Creating a user task and viewing output#
Selection of the well node in the KAPPA-Automate UI show the main toolbar (Fig. 6). To create a user task for a well, select the “User Task” icon.
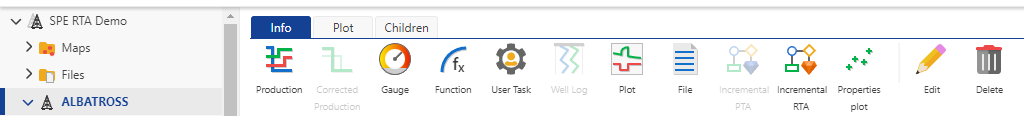
Fig. 6 Snapshot of the main toolbar when selecting a well node in the KAPPA-Automate UI. Select the “User Task” icon to create a user task for the well.#
Upon selection of the icon, the user task UI dialog will appear. Note that all mandatory dataset input will already be assigned to an existing gauge or production data, matching the data type (Fig. 7).
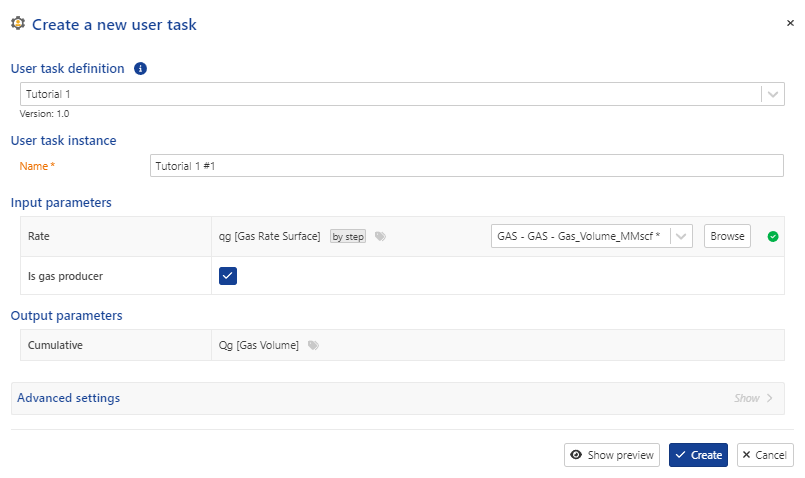
Fig. 7 Creating the Tutorial 1 user task for a well#
Clicking on the “Create” button will create the user task for the well and queue the script for execution. When execution starts, the “Info” tabbed pane will show the user task as “Running”. The “Plot” tab will show all output that the user task creates. In addition, sub-nodes below the user task node will display information and plots for all output (Fig. 8).
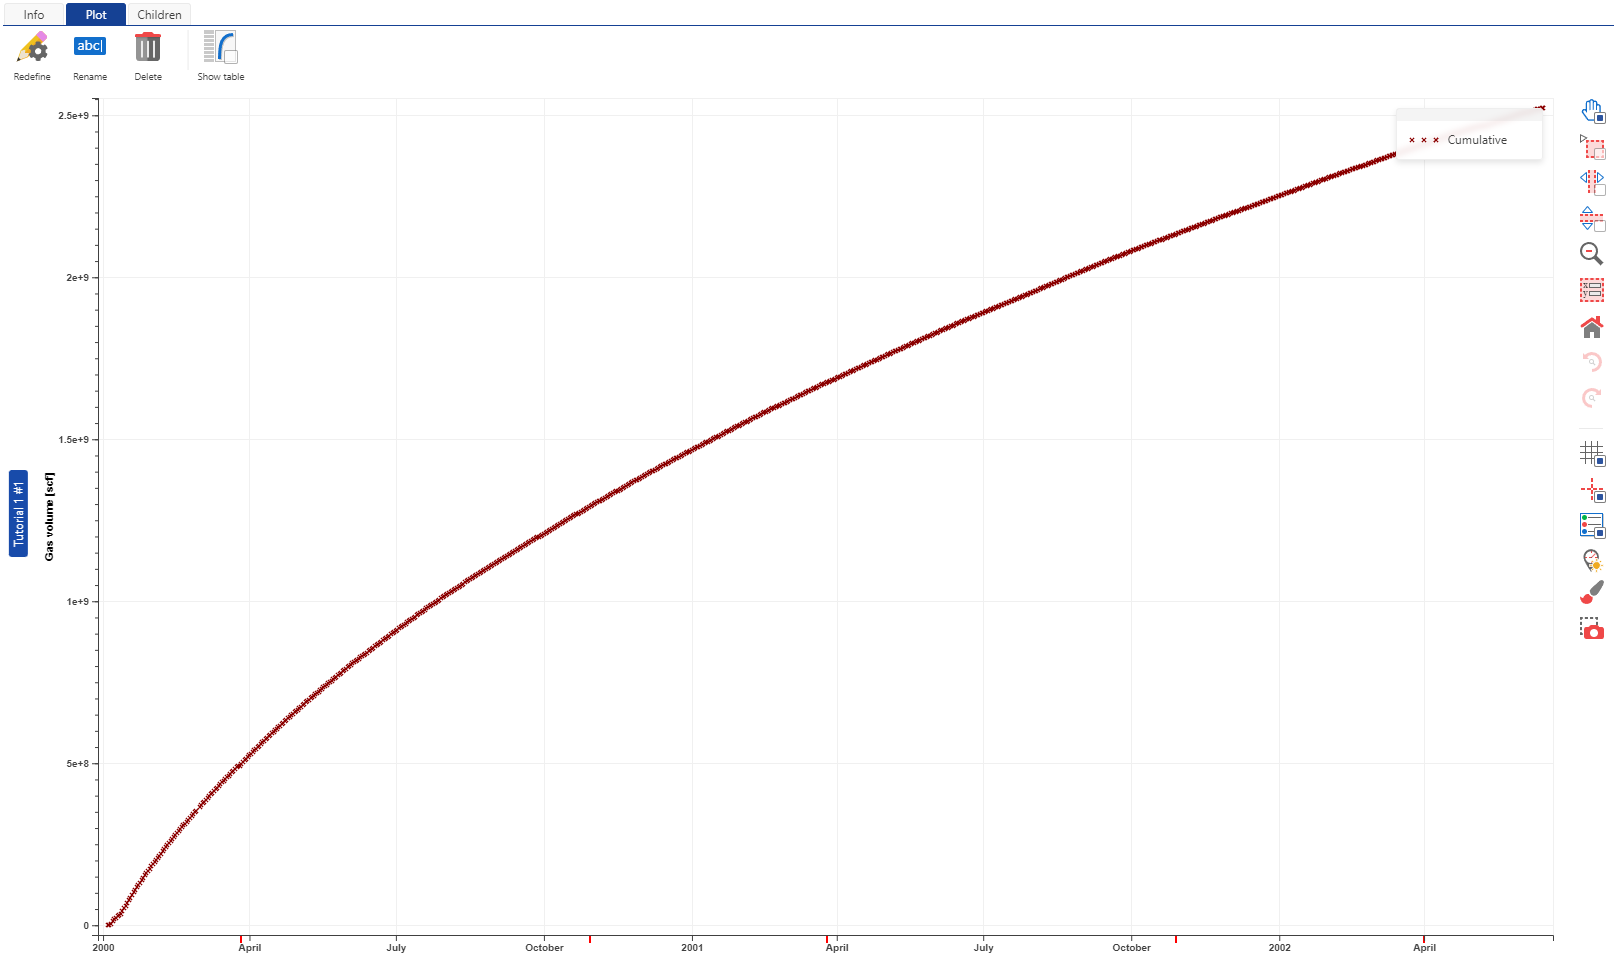
Fig. 8 Output of the Tutorial 1 user task for a well. The cumulative production output itself is available as a node under the user task.#